Occupational Therapist Hourly Pay in Riverside, CA: $59.23 (2026)
Quick Answer:Hourly pay for a occupational therapist working in Riverside, CA runs $59.23 at the median for 2026 — annualizing to $123,188 at a standard 2,080-hour year. Figures projected from BLS OEWS 2025 (SOC 29-1122). Weighted against Riverside's regional price level (BEA RPP 106.4, 6% above national), each hour of work buys what $55.64 nationally would. A 24-hour part-time schedule grosses $73,917 per year.
Official BLS data · View source
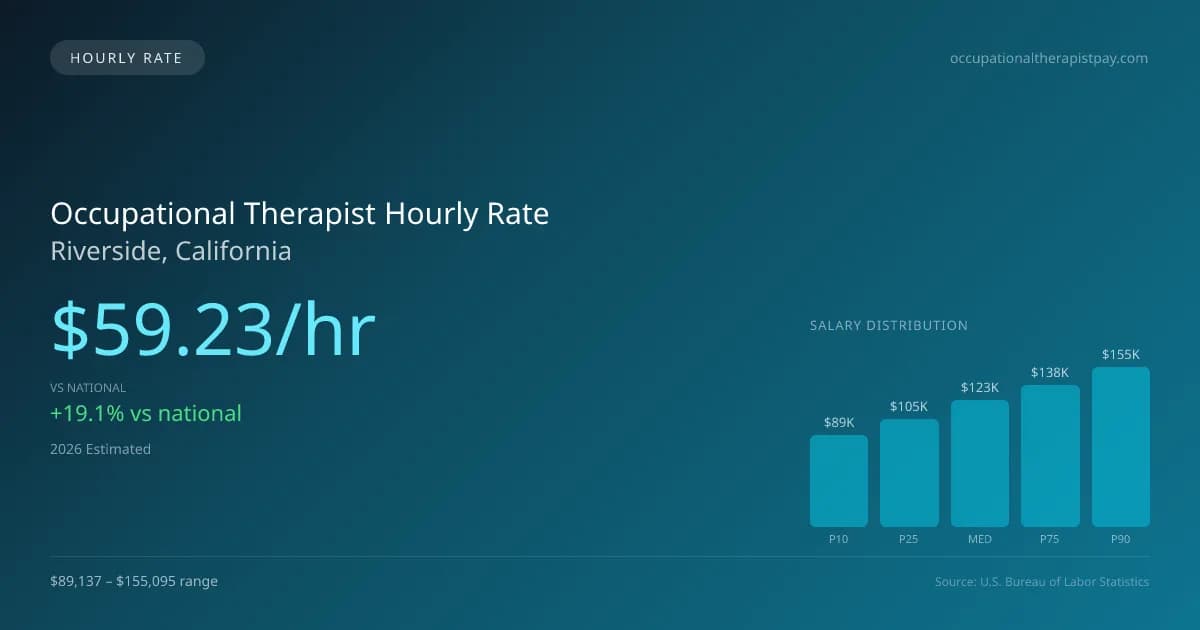
In Riverside, California, the hourly pay for occupational therapists is projected to be $59.23 in 2026, surpassing the national hourly median of $49.71. This competitive rate allows for significant earning potential, particularly for those working part-time or on a per-diem basis. For instance, a typical three-day workweek could yield around $1,125, which would sum to approximately $58,500 annually if sustained throughout the year. The range of hourly earnings spans from $42.85 at the lower end (P10) to $74.56 for top earners (P90), which is critical for professionals considering part-time roles in hospital rehabilitation units, skilled nursing facilities, or school therapy settings. Offering flexibility, per-diem occupational therapist pay in Riverside encourages many therapists to explore opportunities across various care environments, including outpatient clinics and home health visits, contributing to a well-rounded scope of practice.
Occupational Therapist Hourly Wage Breakdown
| Percentile | Hourly Rate | Per 8hr Shift |
|---|---|---|
| Entry Level (P10) | $42.85 | $342.82 |
| Lower Range (P25) | $50.50 | $404.00 |
| Median (P50) | $59.23 | $473.83 |
| Upper Range (P75) | $66.39 | $531.13 |
| Top Earners (P90) | $74.56 | $596.51 |
Estimated Annual Income by Work Schedule in Riverside
Based on $59.23/hr median hourly rate · 2026 est.
At $59.23/hr, a occupational therapist working full-time (40 hr/wk) in Riverside, CA can expect to earn approximately $123,195 per year (2026 est.). Part-time hygienists working 24 hours per week would earn around $71,074. With a cost-of-living index of 106.44 (above the national average), these earnings may be offset by higher expenses in Riverside.
Hourly Rate Calculator
Schedule Comparison in Riverside
| Schedule | Weekly | Monthly | Annual |
|---|---|---|---|
| Full-Time (40 hrs) | $2,369.14 | $10,266 | $123,195 |
| Part-Time (24 hrs) | $1,421.49 | $6,160 | $73,917 |
| Per Diem (16 hrs) | $947.66 | $4,107 | $49,278 |
Compare OT, OTR Wages With Similar Roles
| Role | Median Hourly |
|---|---|
| Occupational Therapist (Riverside) | $59.23 |
| Occupational Therapy Assistant (National Avg) | $33.15 |
| Physical Therapist (National Avg) | $48.65 |
| Speech-Language Pathologist (National Avg) | $43.80 |
| Recreational Therapist (National Avg) | $27.50 |
Occupational Therapists in Riverside, CA earn a median of $123,188 per year (2026 est.), which is 19.14% higher than the national median of $103,400 and 2.60% below the California state average of $126,476.
Occupational Therapist Hourly Pay vs. Cost of Living
Working 24h/week at $59.23/hr = $73,917/year (purchasing power: $69,444).
Working 40h/week (full-time) = $123,195/year (purchasing power: $115,740).
CoL index: 106.442 (100 = national average).
2019 BLS Actual
$50.79/hr
2025 BLS Actual
$57.47/hr
2026 Current Est.
$59.23/hr
2019–2027 Growth
+20.2%
Hourly Rate Trajectory for Occupational Therapists in Riverside (2019–2027)
2019–2025: actual BLS OEWS data for this metro area. 2026+: CAGR 3.06% projection.
| Year | Hourly Rate | Status |
|---|---|---|
| 2019 | $50.79/hr | Actual |
| 2020 | $48.89/hr | Actual |
| 2021 | $47.17/hr | Actual |
| 2022 | $48.34/hr | Actual |
| 2023 | $50.63/hr | Actual |
| 2024 | $52.41/hr | Actual |
| 2025 | $57.47/hr | Actual |
| 2026(current) | $59.23/hr | Estimated |
| 2027 | $61.04/hr | Projected |
Based on 7 years of BLS OEWS metropolitan area data, the median hourly rate for occupational therapists in Riverside grew 13.2% from $50.79/hr (2019) to $57.47/hr (2025). At a 3.06% projected growth rate, hourly pay is expected to reach $61.04/hr by 2027. Part-time and per-diem occupational therapists can use this multi-year trend to benchmark future contract negotiations.
Note: Historical values (2019–2025) are actual BLS OEWS figures for the Riverside metropolitan area, sourced from annual Occupational Employment and Wage Statistics surveys. 2026–2026 figures are current estimates, and 2027 values are projections, calculated using a 3.06% CAGR derived from 7-year BLS historical data. Actual salaries may vary based on employer, experience, certifications, and local market conditions.
Working as an Hourly Occupational Therapist in Riverside
Looking at the earning dynamics in Riverside, occupational therapists working on a part-time basis would earn a considerably different salary compared to their full-time counterparts. For someone working 24 hours a week at $59.23/hour, the annual take-home could be about $46,097, illustrating a strategic choice for those seeking work-life balance. In addition to traditional employment, per-diem occupational therapists often see pay rates ranging from $50 to $75 per hour, with specialized areas like hand therapy commanding even higher rates, potentially reaching as much as $110 per hour for Certified Hand Therapists (CHTs). Hourly compensation can differ greatly depending on the type of employer: skilled nursing facilities might offer slightly lower rates compared to hospitals or outpatient clinics. The trade-off of working for lower hourly pay might appeal to those valuing steady health insurance and benefits, while others might prefer the flexibility of higher hourly pay without benefits. Negotiating for better rates in Riverside can involve leveraging specialty credentials or experience, considering various types of contracts and opportunities within the local job market.
More salary data for Riverside, CA:
Frequently Asked Questions
What is the hourly rate for occupational therapists in Riverside in 2026?
How much do part-time occupational therapists make in Riverside?
Are occupational therapists in Riverside paid hourly or salary?
How much does a full-time occupational therapist make per year in Riverside?
Do occupational therapists earn more per hour working part-time in Riverside?
Related Pages
Compare Salaries
Career Resources
Nearby Cities in California
Written by Jordan Miller, OTR/L
Career Analyst
Jordan has 10 years of experience in occupational therapy. They specialize in pediatrics and work in a rehabilitation clinic.
Methodology & Data Source
Hourly wage figures on this page are 2026 projections based on the Bureau of Labor Statistics Occupational Employment and Wage Statistics (OEWS) survey, May 2026 release. A 3.06% compound annual growth rate (CAGR), derived from 6-year national BLS wage trends, was applied to estimate current 2026 hourly rates for occupational therapists in Riverside. Part-time and full-time income estimates assume consistent weekly hours and do not account for overtime, benefits, or seasonal variation.
Data Sources & Methodology
Source: BLS, OEWS, 7-year dataset (–). Per-city data from annual BLS metropolitan area surveys.
2026 figures are projected from 2025 BLS data using a compound annual growth rate (CAGR) of 3.06%, derived from historical BLS wage trends for occupational therapists (SOC 29-1122).
Compiled and verified by Jordan Miller, OTR/L, a licensed occupational therapist with 10+ years of clinical experience. · View source data at BLS.gov