Occupational Therapist Hourly Pay in Richmond, VA: $52.29 (2026)
Quick Answer:Hourly pay for a occupational therapist working in Richmond, VA runs $52.29 at the median for 2026 — annualizing to $108,780 at a standard 2,080-hour year. Figures projected from BLS OEWS 2025 (SOC 29-1122). Weighted against Richmond's regional price level (BEA RPP 97.9, 2% below national), each hour of work buys what $53.44 nationally would. A 24-hour part-time schedule grosses $65,261 per year.
Official BLS data · View source
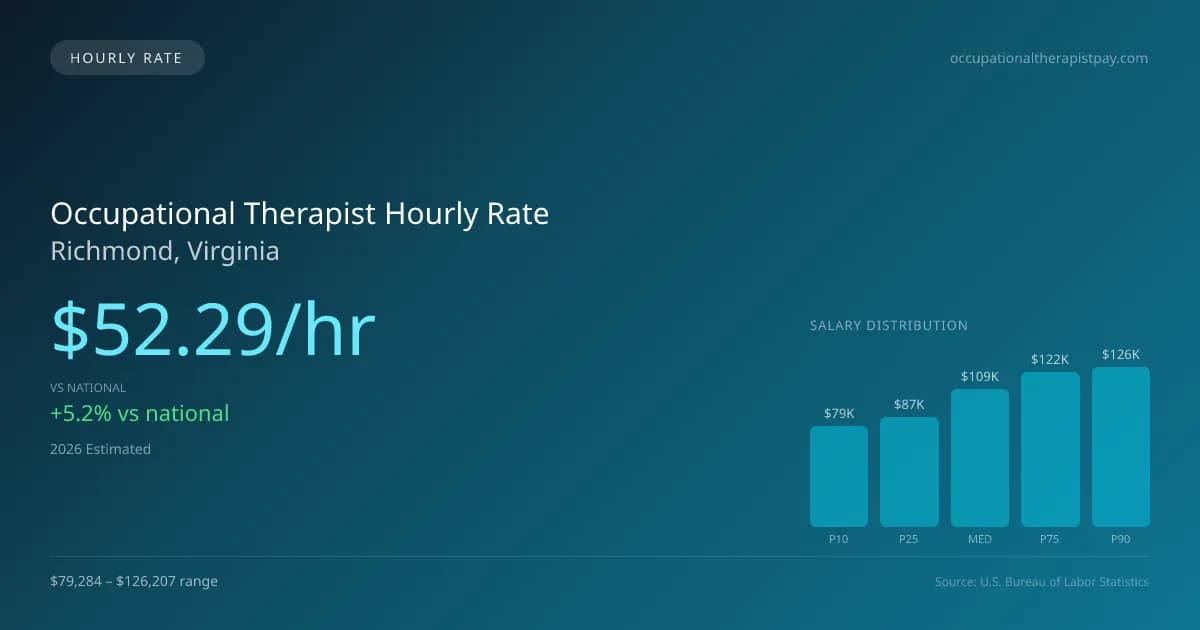
In Richmond, Virginia, occupational therapists earn a median hourly rate of $52.29, which surpasses the national median of $49.71. This competitive pay significantly enhances the attractiveness of positions for part-time or per-diem professionals. For those working in settings like hospital rehab units, skilled nursing facilities, and outpatient hand therapy clinics, this hourly rate allows for substantial income potential while maintaining flexible schedules. The hourly earnings for entry-level occupational therapists typically begin around $38.12, and can ascend to $60.68 for those in higher-paying roles or with specialized credentials. The data presented is based on 2025 BLS OEWS data, projected to 2026.
Occupational Therapist Hourly Wage Breakdown
| Percentile | Hourly Rate | Per 8hr Shift |
|---|---|---|
| Entry Level (P10) | $38.12 | $304.98 |
| Lower Range (P25) | $41.69 | $333.50 |
| Median (P50) | $52.29 | $418.34 |
| Upper Range (P75) | $58.80 | $470.37 |
| Top Earners (P90) | $60.68 | $485.45 |
Estimated Annual Income by Work Schedule in Richmond
Based on $52.29/hr median hourly rate · 2026 est.
At $52.29/hr, a occupational therapist working full-time (40 hr/wk) in Richmond, VA can expect to earn approximately $108,769 per year (2026 est.). Part-time hygienists working 24 hours per week would earn around $62,751. With a cost-of-living index of 97.86 (below the national average), these earnings stretch further in Richmond.
Hourly Rate Calculator
Schedule Comparison in Richmond
| Schedule | Weekly | Monthly | Annual |
|---|---|---|---|
| Full-Time (40 hrs) | $2,091.71 | $9,064 | $108,769 |
| Part-Time (24 hrs) | $1,255.02 | $5,438 | $65,261 |
| Per Diem (16 hrs) | $836.68 | $3,626 | $43,507 |
Compare OT, OTR Wages With Similar Roles
| Role | Median Hourly |
|---|---|
| Occupational Therapist (Richmond) | $52.29 |
| Occupational Therapy Assistant (National Avg) | $33.15 |
| Physical Therapist (National Avg) | $48.65 |
| Speech-Language Pathologist (National Avg) | $43.80 |
| Recreational Therapist (National Avg) | $27.50 |
Occupational Therapists in Richmond, VA earn a median of $108,780 per year (2026 est.), which is 5.20% higher than the national median of $103,400 and 6.20% above the Virginia state average of $102,429.
Occupational Therapist Hourly Pay vs. Cost of Living
Working 24h/week at $52.29/hr = $65,261/year (purchasing power: $66,690).
Working 40h/week (full-time) = $108,769/year (purchasing power: $111,150).
CoL index: 97.858 (100 = national average). Your dollars stretch further here.
2019 BLS Actual
$41.16/hr
2025 BLS Actual
$50.74/hr
2026 Current Est.
$52.29/hr
2019–2027 Growth
+30.9%
Hourly Rate Trajectory for Occupational Therapists in Richmond (2019–2027)
2019–2025: actual BLS OEWS data for this metro area. 2026+: CAGR 3.06% projection.
| Year | Hourly Rate | Status |
|---|---|---|
| 2019 | $41.16/hr | Actual |
| 2020 | $43.25/hr | Actual |
| 2021 | $42.39/hr | Actual |
| 2022 | $46.39/hr | Actual |
| 2023 | $47.30/hr | Actual |
| 2024 | $50.00/hr | Actual |
| 2025 | $50.74/hr | Actual |
| 2026(current) | $52.29/hr | Estimated |
| 2027 | $53.89/hr | Projected |
Based on 7 years of BLS OEWS metropolitan area data, the median hourly rate for occupational therapists in Richmond grew 23.3% from $41.16/hr (2019) to $50.74/hr (2025). At a 3.06% projected growth rate, hourly pay is expected to reach $53.89/hr by 2027. Part-time and per-diem occupational therapists can use this multi-year trend to benchmark future contract negotiations.
Note: Historical values (2019–2025) are actual BLS OEWS figures for the Richmond metropolitan area, sourced from annual Occupational Employment and Wage Statistics surveys. 2026–2026 figures are current estimates, and 2027 values are projections, calculated using a 3.06% CAGR derived from 7-year BLS historical data. Actual salaries may vary based on employer, experience, certifications, and local market conditions.
Working as an Hourly Occupational Therapist in Richmond
Occupational therapists working part-time in Richmond can expect to take home approximately $54,893 annually, based on a 24-hour workweek, which is considerably less than their full-time counterparts. For those opting for per-diem roles, billing rates can vary from $50 to $75 per hour, while certified hand therapists can command between $80 and $110 in cash-pay practices. Travel contracts present another lucrative avenue, offering weekly pay between $1,800 and $2,800. Hourly rates do fluctuate based on the employer type, with skilled nursing facilities and home health agencies typically offering less than hospital inpatient rehab or outpatient clinics. Many occupational therapists face the decision of whether to accept lower hourly rates for positions with benefits versus higher rates without coverage, a crucial factor in Richmond’s job market. Negotiation skills tailored to local circumstances can be vital, with a focus on the overall compensation package rather than just the hourly rate.
More salary data for Richmond, VA:
Frequently Asked Questions
What is the hourly rate for occupational therapists in Richmond in 2026?
How much do part-time occupational therapists make in Richmond?
Are occupational therapists in Richmond paid hourly or salary?
How much does a full-time occupational therapist make per year in Richmond?
Do occupational therapists earn more per hour working part-time in Richmond?
Related Pages
Compare Salaries
Career Resources
Nearby Cities in Virginia
Written by Jordan Miller, OTR/L
Career Analyst
Jordan has 10 years of experience in occupational therapy. They specialize in pediatrics and work in a rehabilitation clinic.
Methodology & Data Source
Hourly wage figures on this page are 2026 projections based on the Bureau of Labor Statistics Occupational Employment and Wage Statistics (OEWS) survey, May 2026 release. A 3.06% compound annual growth rate (CAGR), derived from 6-year national BLS wage trends, was applied to estimate current 2026 hourly rates for occupational therapists in Richmond. Part-time and full-time income estimates assume consistent weekly hours and do not account for overtime, benefits, or seasonal variation.
Data Sources & Methodology
Source: BLS, OEWS, 7-year dataset (–). Per-city data from annual BLS metropolitan area surveys.
2026 figures are projected from 2025 BLS data using a compound annual growth rate (CAGR) of 3.06%, derived from historical BLS wage trends for occupational therapists (SOC 29-1122).
Compiled and verified by Jordan Miller, OTR/L, a licensed occupational therapist with 10+ years of clinical experience. · View source data at BLS.gov