Occupational Therapist Salary in Hot Springs, AR: $84,932 (2026)
Quick Answer:A full-time occupational therapist in Hot Springs, AR earns a median $84,932/year (≈ $40.83/hour) in nominal terms for 2026 — projected from BLS OEWS 2025 (SOC 29-1122). Once you factor in Hot Springs's price level (14% below national, BEA RPP 85.7), that paycheck buys what $99,069 would nationally. Nominal pay sits 21.3% below the Arkansas state average.
Official BLS data · View source
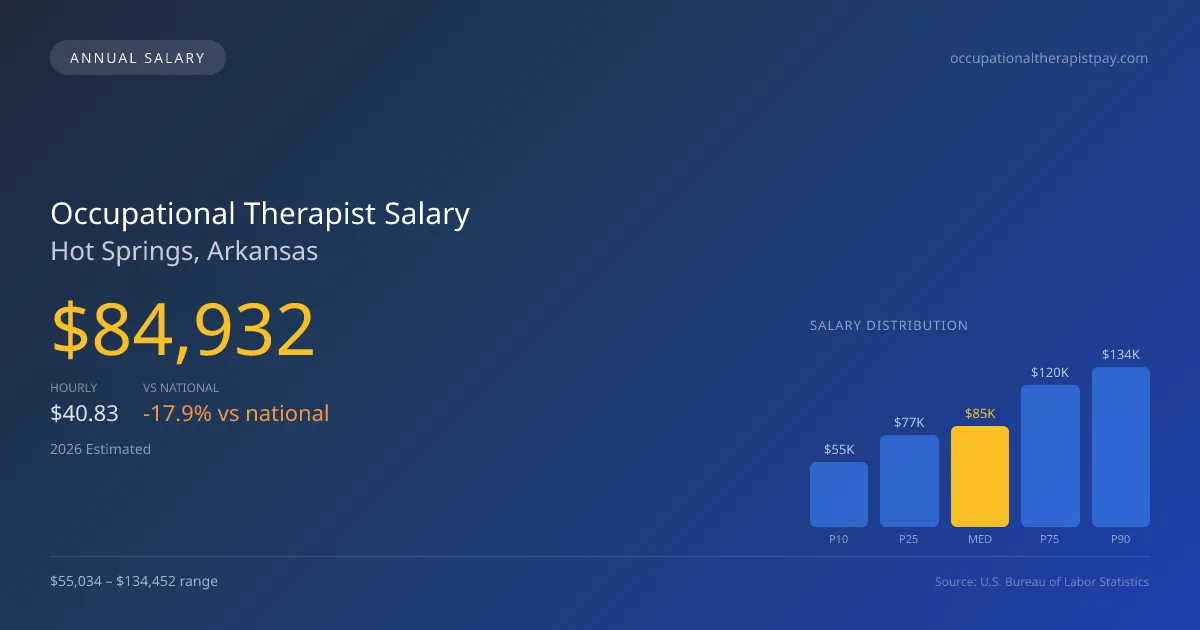
In Hot Springs, Arkansas, the projected occupational therapist salary for 2026 is estimated at $84,932, which reflects a notable 17.86% lower comparison to the national median of $103,400. Salary estimates show a range from $55,034 at the 10th percentile to $134,452 at the 90th percentile. This data is grounded in 2025 BLS OEWS surveys, indicating a diverse compensation landscape for therapists within the area. Specializing with a Certified Hand Therapist (CHT) certification can significantly increase an occupational therapist's earning potential. Given the local demand for skilled professionals, pursuing board certifications like CHT is a strategic approach to enhancing one’s compensation and marketability in Hot Springs.
Salary Breakdown
| Percentile | Annual | Hourly |
|---|---|---|
| Entry Level (P10) | $55,034 | $26.46 |
| Lower Range (P25) | $77,202 | $37.11 |
| Median (P50)(typical) | $84,932 | $40.83 |
| Upper Range (P75) | $119,673 | $57.54 |
| Top Earners (P90) | $134,452 | $64.64 |
Median Salary Position
17.86% below the national average
2026 Salary Percentile Distribution in Hot Springs
In Hot Springs, AR, the occupational therapist salary spread from the 10th to 90th percentile is $79,418 (2026 est.). At $84,932, the local median is 17.86% below the national median of $103,400.
Salary Calculator
At 40 hours/week in Hot Springs: You'd be in the lower-middle range
How Hot Springs Occupational Therapist Pay Compares
Hot Springs median: $84,932/year (2026)
| Compared To | Median Salary | Hot Springs Pays |
|---|---|---|
| Arkansas Average | $107,918 | -21.30% less |
| National Average | $103,400 | -17.86% less |
Occupational Therapists in Hot Springs, AR earn a median of $84,932 per year (2026 est.), which is 17.86% lower than the national median of $103,400 and 21.30% below the Arkansas state average of $107,918.
Cost-of-Living Adjusted Salary
Hot Springs has a cost of living 14.27% below the national average, meaning your salary goes further here.
Adjusted salary = nominal × (100 / CoL index). CoL index: 100 = national average.
Hot Springs, AR has a cost-of-living index of 85.73 (below the national average of 100). A occupational therapist earning $84,932 nominally has purchasing power equivalent to $99,069 in an average-cost city — an effective 16.65% boost.
Compare Purchasing Power
Select a city to see how your salary compares after cost of living
Select a city above to compare purchasing power
2019 BLS Actual
$74,650
2025 BLS Actual
$82,410
2026 Current Est.
$84,932
2019–2027 Growth
+17.3%
Salary Trajectory for Occupational Therapists in Hot Springs (2019–2027)
2019–2025: actual BLS OEWS data for this metro area. 2026+: CAGR 3.06% projection.
| Year | Annual Salary | Status |
|---|---|---|
| 2019 | $74,650 | Actual |
| 2020 | $73,990 | Actual |
| 2021 | $74,670 | Actual |
| 2022 | $72,490 | Actual |
| 2023 | $77,770 | Actual |
| 2024 | $77,430 | Actual |
| 2025 | $82,410 | Actual |
| 2026(current) | $84,932 | Estimated |
| 2027 | $87,531 | Projected |
Based on 7 years of BLS OEWS data for the Hot Springs metropolitan area, the median occupational therapist salary grew 10.4% from $74,650 (2019) to $82,410 (2025). At a 3.06% compound annual growth rate, salaries are projected to reach $87,531 by 2027 — a total increase of $12,881 (17.26%) from 2019.
Note: Historical values (2019–2025) are actual BLS OEWS figures for the Hot Springs metropolitan area, sourced from annual Occupational Employment and Wage Statistics surveys. 2026–2026 figures are current estimates, and 2027 values are projections, calculated using a 3.06% CAGR derived from 7-year BLS historical data. Actual salaries may vary based on employer, experience, certifications, and local market conditions.
Salary by Experience Level
| Experience | Estimated Salary Range |
|---|---|
| 0-2 years (New Graduate) | $55,034 – $77,202 |
| 3-5 years (Mid Career) | $77,202 – $84,932 |
| 5+ years (Experienced) | $84,932 – $119,673 |
| 10+ years (Top Earner) | $119,673 – $134,452 |
OT, OTR salary ranges estimated from BLS percentile data. Individual occupational therapist compensation varies by employer, certifications, and specialization.
Occupational Therapist Job Market in Hot Springs
A solid number of 100 occupational therapists are currently employed in Hot Springs, contributing to a competitive job market. The cost of living index, sitting at 85.73, indicates that while salaries may be lower than the national average, they can still provide a reasonable standard of living. Among the primary employers, settings like skilled nursing facilities and hospital inpatient rehabilitation tend to offer higher salaries, while school districts and early intervention programs may present lower pay. The disparity in wages can be attributed to factors such as productivity demands, contract lengths, and whether the therapist holds additional certifications. For those in the Hot Springs AR area, securing employment in higher-paying environments and pursuing specialty training can significantly impact overall earnings and job satisfaction, making it essential for individuals to align their skills with market needs for optimal compensation outcomes.
More salary data for Hot Springs, AR:
Frequently Asked Questions
How much do occupational therapists make in Hot Springs, AR in 2026?
Is Hot Springs, AR a good place to work as a occupational therapist?
Can occupational therapists make $100K in Hot Springs?
What is the cost-of-living adjusted occupational therapist salary in Hot Springs?
How much does a occupational therapist make per hour in Hot Springs?
Related Pages
Compare Salaries
Career Resources
Nearby Cities in Arkansas
Written by Jordan Miller, OTR/L
Career Analyst
Jordan has 10 years of experience in occupational therapy. They specialize in pediatrics and work in a rehabilitation clinic.
Methodology & Data Source
Salary figures on this page are 2026 projections based on the Bureau of Labor Statistics Occupational Employment and Wage Statistics (OEWS) survey, May 2026 release. The BLS reported a median annual salary of $82,410 for occupational therapistsin the Hot Springs metropolitan area. A 3.06% compound annual growth rate (CAGR), calculated from 6-year national BLS wage trends, was applied to project current 2026 compensation. Percentile ranges (P10–P90) represent the full salary distribution across experience levels and practice settings in this market.
Data Sources & Methodology
Source: BLS, OEWS, 7-year dataset (–). Per-city data from annual BLS metropolitan area surveys.
2026 figures are projected from 2025 BLS data using a compound annual growth rate (CAGR) of 3.06%, derived from historical BLS wage trends for occupational therapists (SOC 29-1122).
Compiled and verified by Jordan Miller, OTR/L, a licensed occupational therapist with 10+ years of clinical experience. · View source data at BLS.gov