Occupational Therapist Salary in Sacramento, CA: $126,537 (2026)
Quick Answer:A full-time occupational therapist in Sacramento, CA earns a median $126,537/year (≈ $60.84/hour) in nominal terms for 2026 — projected from BLS OEWS 2025 (SOC 29-1122). Once you factor in Sacramento's price level (7% above national, BEA RPP 106.7), that paycheck buys what $118,625 would nationally. Nominal pay sits 0.0% above the California state average.
Official BLS data · View source
In 2026, the expected occupational therapist salary in Sacramento, CA is projected to be $126,537, which represents a 22.38% increase compared to the national median of $103,400. The salary range for this profession spans from $97,814 at the 10th percentile to $159,681 at the 90th percentile, indicating a healthy variation depending on the work setting and experience level. Based on 2025 BLS OEWS data, projected to 2026, this compensation landscape reflects the demand for occupational therapists in the area. Therapists can find opportunities in hospitals, skilled nursing facilities, or school systems, each with their unique pay structures and commitments, as well as year-round versus school-year contracts that influence earnings and work-life balance.
Salary Breakdown
| Percentile | Annual | Hourly |
|---|---|---|
| Entry Level (P10) | $97,814 | $47.03 |
| Lower Range (P25) | $110,449 | $53.10 |
| Median (P50)(typical) | $126,537 | $60.84 |
| Upper Range (P75) | $140,440 | $67.51 |
| Top Earners (P90) | $159,681 | $76.77 |
Median Salary Position
22.38% above the national average
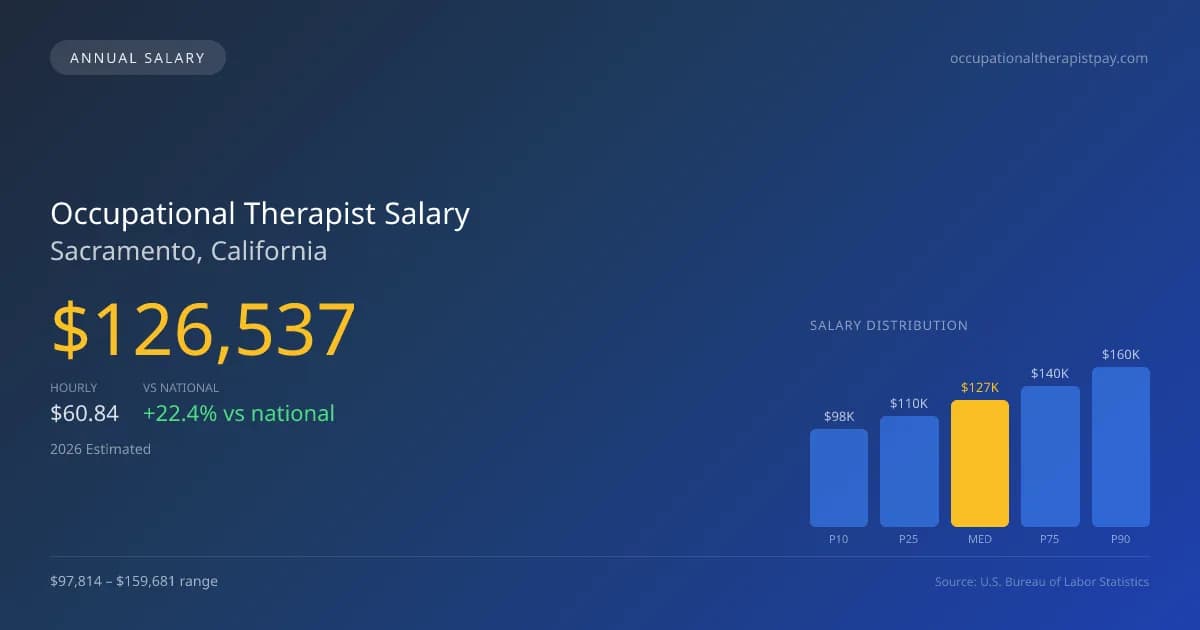
2026 Salary Percentile Distribution in Sacramento
In Sacramento, CA, the occupational therapist salary spread from the 10th to 90th percentile is $61,867 (2026 est.). At $126,537, the local median is 22.38% above the national median of $103,400.
Salary Calculator
At 40 hours/week in Sacramento: You'd be in the lower-middle range
How Sacramento Occupational Therapist Pay Compares
Sacramento median: $126,537/year (2026)
| Compared To | Median Salary | Sacramento Pays |
|---|---|---|
| National Average | $103,400 | +22.38% more |
Occupational Therapists in Sacramento, CA earn a median of $126,537 per year (2026 est.), which is 22.38% higher than the national median of $103,400.
Cost-of-Living Adjusted Salary
Sacramento has a cost of living 6.67% above the national average.
Adjusted salary = nominal × (100 / CoL index). CoL index: 100 = national average.
Sacramento, CA has a cost-of-living index of 106.67 (above the national average of 100). While the nominal salary of $126,537 is competitive, the higher cost of living reduces purchasing power to an effective $118,625 — a 6.25% reduction.
Compare Purchasing Power
Select a city to see how your salary compares after cost of living
Select a city above to compare purchasing power
2019 BLS Actual
$100,290
2025 BLS Actual
$122,780
2026 Current Est.
$126,537
2019–2027 Growth
+30.0%
Salary Trajectory for Occupational Therapists in Sacramento (2019–2027)
2019–2025: actual BLS OEWS data for this metro area. 2026+: CAGR 3.06% projection.
| Year | Annual Salary | Status |
|---|---|---|
| 2019 | $100,290 | Actual |
| 2020 | $105,850 | Actual |
| 2021 | $102,010 | Actual |
| 2022 | $110,710 | Actual |
| 2023 | $120,900 | Actual |
| 2024 | $123,900 | Actual |
| 2025 | $122,780 | Actual |
| 2026(current) | $126,537 | Estimated |
| 2027 | $130,409 | Projected |
Based on 7 years of BLS OEWS data for the Sacramento metropolitan area, the median occupational therapist salary grew 22.4% from $100,290 (2019) to $122,780 (2025). At a 3.06% compound annual growth rate, salaries are projected to reach $130,409 by 2027 — a total increase of $30,119 (30.03%) from 2019.
Note: Historical values (2019–2025) are actual BLS OEWS figures for the Sacramento metropolitan area, sourced from annual Occupational Employment and Wage Statistics surveys. 2026–2026 figures are current estimates, and 2027 values are projections, calculated using a 3.06% CAGR derived from 7-year BLS historical data. Actual salaries may vary based on employer, experience, certifications, and local market conditions.
Salary by Experience Level
| Experience | Estimated Salary Range |
|---|---|
| 0-2 years (New Graduate) | $97,814 – $110,449 |
| 3-5 years (Mid Career) | $110,449 – $126,537 |
| 5+ years (Experienced) | $126,537 – $140,440 |
| 10+ years (Top Earner) | $140,440 – $159,681 |
OT, OTR salary ranges estimated from BLS percentile data. Individual occupational therapist compensation varies by employer, certifications, and specialization.
Occupational Therapist Job Market in Sacramento
Currently, there are about 810 occupational therapists employed in Sacramento, underscoring a robust local job market. The living cost index of 106.67 signifies that the cost of living is slightly above the national average, impacting overall purchasing power for therapists in the region. Professionals often find the highest salaries in hospital inpatient rehabilitation settings compared to outpatient clinics and school districts. Several factors contribute to pay disparities, such as board certifications like the Certified Hand Therapist (CHT) credential, setting expectations in productivity, and varying how contracts are structured. For those looking to maximize their occupational therapist pay in Sacramento, actively pursuing additional certifications and seeking positions in high-demand facilities can significantly enhance financial growth in this promising job market.
More salary data for Sacramento, CA:
Frequently Asked Questions
How much do occupational therapists make in Sacramento, CA in 2026?
Is Sacramento, CA a good place to work as a occupational therapist?
Can occupational therapists make $100K in Sacramento?
What is the cost-of-living adjusted occupational therapist salary in Sacramento?
How much does a occupational therapist make per hour in Sacramento?
Related Pages
Compare Salaries
Career Resources
Nearby Cities in California
Written by Jordan Miller, OTR/L
Career Analyst
Jordan has 10 years of experience in occupational therapy. They specialize in pediatrics and work in a rehabilitation clinic.
Methodology & Data Source
Salary figures on this page are 2026 projections based on the Bureau of Labor Statistics Occupational Employment and Wage Statistics (OEWS) survey, May 2026 release. The BLS reported a median annual salary of $122,780 for occupational therapistsin the Sacramento metropolitan area. A 3.06% compound annual growth rate (CAGR), calculated from 6-year national BLS wage trends, was applied to project current 2026 compensation. Percentile ranges (P10–P90) represent the full salary distribution across experience levels and practice settings in this market.
Data Sources & Methodology
Source: BLS, OEWS, 7-year dataset (–). Per-city data from annual BLS metropolitan area surveys.
2026 figures are projected from 2025 BLS data using a compound annual growth rate (CAGR) of 3.06%, derived from historical BLS wage trends for occupational therapists (SOC 29-1122).
Compiled and verified by Jordan Miller, OTR/L, a licensed occupational therapist with 10+ years of clinical experience. · View source data at BLS.gov