Occupational Therapist Salary in Castle Rock, CO: $107,387 (2026)
Quick Answer:A full-time occupational therapist in Castle Rock, CO earns a median $107,387/year (≈ $51.63/hour) in nominal terms for 2026 — projected from BLS OEWS 2025 (SOC 29-1122). Once you factor in Castle Rock's price level (5% above national, BEA RPP 105.0), that paycheck buys what $102,273 would nationally. Nominal pay sits 1.5% below the Colorado state average.
Based on BLS state-level estimates · View source
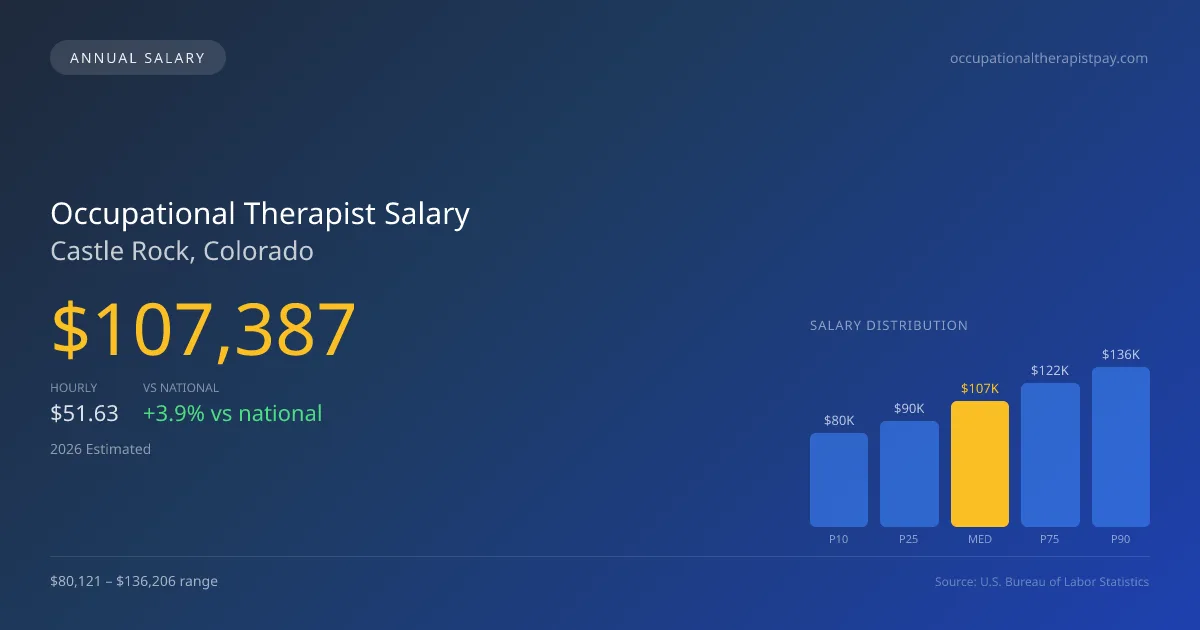
In 2026, occupational therapists in Castle Rock, Colorado, can expect to earn a median annual salary of $107,387, which is approximately 3.86% higher than the national median of $103,400. The local salary range spans from $80,121 at the 10th percentile to $136,206 at the 90th percentile, reflecting a competitive market influenced by past Medicare cuts that have impacted compensation across skilled nursing facilities and outpatient settings since 2022. These figures are based on estimates derived from 2025 BLS data, adjusted for local economic conditions, and indicate a robust job market for occupational therapists, poised for steady growth.
About the Castle Rock Market
Salary estimated from Colorado average ($90,000) adjusted for local cost of living.
Salary Breakdown
| Percentile | Annual | Hourly |
|---|---|---|
| Entry Level (P10) | $80,121 | $38.52 |
| Lower Range (P25) | $90,381 | $43.45 |
| Median (P50)(typical) | $107,387 | $51.63 |
| Upper Range (P75) | $122,335 | $58.82 |
| Top Earners (P90) | $136,206 | $65.48 |
Median Salary Position
3.86% above the national average
2026 Salary Percentile Distribution in Castle Rock
In Castle Rock, CO, the occupational therapist salary spread from the 10th to 90th percentile is $56,085 (2026 est.). At $107,387, the local median is 3.86% above the national median of $103,400.
Salary Calculator
At 40 hours/week in Castle Rock: You'd be in the lower-middle range
How Castle Rock Occupational Therapist Pay Compares
Castle Rock median: $107,387/year (2026)
| Compared To | Median Salary | Castle Rock Pays |
|---|---|---|
| Colorado Average | $109,023 | -1.50% less |
| National Average | $103,400 | +3.86% more |
Occupational Therapists in Castle Rock, CO earn a median of $107,387 per year (2026 est.), which is 3.86% higher than the national median of $103,400 and 1.50% below the Colorado state average of $109,023.
Cost-of-Living Adjusted Salary
Castle Rock has a cost of living 5.00% above the national average.
Adjusted salary = nominal × (100 / CoL index). CoL index: 100 = national average.
Castle Rock, CO has a cost-of-living index of 105 (above the national average of 100). While the nominal salary of $107,387 is competitive, the higher cost of living reduces purchasing power to an effective $102,273 — a 4.76% reduction.
Compare Purchasing Power
Select a city to see how your salary compares after cost of living
Select a city above to compare purchasing power
2019 BLS Actual
$88,226
2025 BLS Actual
$104,199
2026 Current Est.
$107,387
2019–2027 Growth
+25.4%
Salary Trajectory for Occupational Therapists in Castle Rock (2019–2027)
2019–2025: actual BLS OEWS data for this metro area. 2026+: CAGR 3.06% projection.
| Year | Annual Salary | Status |
|---|---|---|
| 2019 | $88,226 | Actual |
| 2020 | $89,607 | Actual |
| 2021 | $88,870 | Actual |
| 2022 | $96,773 | Actual |
| 2023 | $100,086 | Actual |
| 2024 | $93,087 | Actual |
| 2025 | $104,199 | Actual |
| 2026(current) | $107,387 | Estimated |
| 2027 | $110,674 | Projected |
Based on 7 years of BLS OEWS data for the Castle Rock metropolitan area, the median occupational therapist salary grew 18.1% from $88,226 (2019) to $104,199 (2025). At a 3.06% compound annual growth rate, salaries are projected to reach $110,674 by 2027 — a total increase of $22,448 (25.44%) from 2019.
Note: Historical values (2019–2025) are actual BLS OEWS figures for the Castle Rock metropolitan area, sourced from annual Occupational Employment and Wage Statistics surveys. 2026–2026 figures are current estimates, and 2027 values are projections, calculated using a 3.06% CAGR derived from 7-year BLS historical data. Actual salaries may vary based on employer, experience, certifications, and local market conditions.
Salary by Experience Level
| Experience | Estimated Salary Range |
|---|---|
| 0-2 years (New Graduate) | $80,121 – $90,381 |
| 3-5 years (Mid Career) | $90,381 – $107,387 |
| 5+ years (Experienced) | $107,387 – $122,335 |
| 10+ years (Top Earner) | $122,335 – $136,206 |
OT, OTR salary ranges estimated from BLS percentile data. Individual occupational therapist compensation varies by employer, certifications, and specialization.
Occupational Therapist Job Market in Castle Rock
With 14 occupational therapists currently employed in Castle Rock, the local job market shows a solid demand for professionals in the field. Representing a cost-of-living index of 105, living expenses in Castle Rock can affect take-home purchasing power, pushing therapists to consider roles in settings that offer higher compensation. Positions in hospital inpatient rehabilitation tend to provide the most competitive pay, while opportunities in school districts and early intervention programs may come with less financial reward, but often offer more stability. Factors contributing to the pay disparity include settings in which therapists work, specialty certifications like the Certified Hand Therapist (CHT), productivity expectations, and the differing contract structures of year-round versus school-year positions. For therapists aiming to maximize their earnings in this market, obtaining specialty certifications and targeting higher-paying facilities can be vital strategies.
More salary data for Castle Rock, CO:
Frequently Asked Questions
How much do occupational therapists make in Castle Rock, CO in 2026?
Is Castle Rock, CO a good place to work as a occupational therapist?
Can occupational therapists make $100K in Castle Rock?
What is the cost-of-living adjusted occupational therapist salary in Castle Rock?
How much does a occupational therapist make per hour in Castle Rock?
Related Pages
Compare Salaries
Career Resources
Nearby Cities in Colorado
Written by Jordan Miller, OTR/L
Career Analyst
Jordan has 10 years of experience in occupational therapy. They specialize in pediatrics and work in a rehabilitation clinic.
Methodology & Data Source
Salary figures on this page are 2026 projections based on the Bureau of Labor Statistics Occupational Employment and Wage Statistics (OEWS) survey, May 2026 release. The BLS reported a median annual salary of $104,199 for occupational therapistsin the Castle Rock metropolitan area. A 3.06% compound annual growth rate (CAGR), calculated from 6-year national BLS wage trends, was applied to project current 2026 compensation. Percentile ranges (P10–P90) represent the full salary distribution across experience levels and practice settings in this market.
Data Sources & Methodology
Salary data for Castle Rock is estimated from official BLS state-level occupational wage data (2025), adjusted for regional cost-of-living differences using BEA RPP (Regional Price Parities).
2026 figures are projected from 2025 BLS data using a compound annual growth rate (CAGR) of 3.06%, derived from historical BLS wage trends for occupational therapists (SOC 29-1122).
Compiled and verified by Jordan Miller, OTR/L, a licensed occupational therapist with 10+ years of clinical experience. · View source data at BLS.gov