Occupational Therapist Salary in Sebring, FL: $98,896 (2026)
Quick Answer:A full-time occupational therapist in Sebring, FL earns a median $98,896/year (≈ $47.54/hour) in nominal terms for 2026 — projected from BLS OEWS 2025 (SOC 29-1122). Once you factor in Sebring's price level (8% below national, BEA RPP 92.5), that paycheck buys what $106,949 would nationally. Nominal pay sits 2.4% below the Florida state average.
Official BLS data · View source
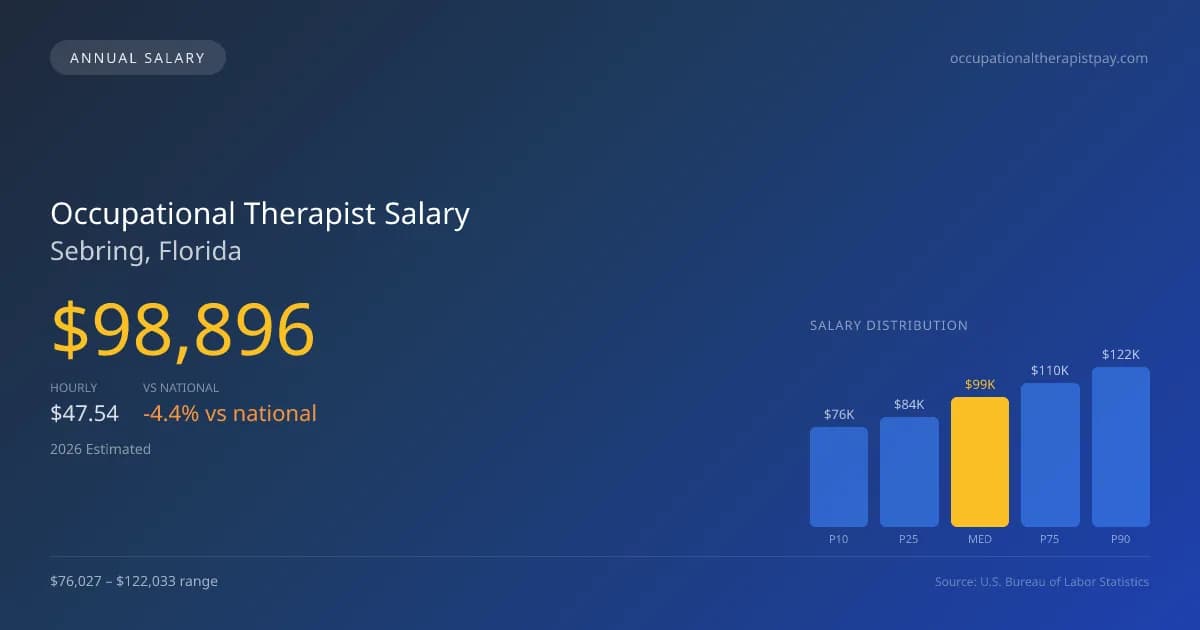
In Sebring, Florida, occupational therapists earn a median annual salary of $98,896, which reflects a slight decrease compared to the national median of $103,400. The salary range for this role varies significantly, with professionals earning between $76,027 at the 10th percentile and $122,033 at the 90th percentile. These figures come from official Bureau of Labor Statistics (BLS) OEWS surveys and highlight the local employment landscape. The choice of practice setting can heavily influence compensation; therapists working in hospitals typically earn more than those in schools or skilled nursing facilities (SNFs). This variance, combined with the seasonal demands of year-round versus school-year contracts, creates a unique financial scenario for OTs in Sebring.
Salary Breakdown
| Percentile | Annual | Hourly |
|---|---|---|
| Entry Level (P10) | $76,027 | $36.56 |
| Lower Range (P25) | $84,076 | $40.42 |
| Median (P50)(typical) | $98,896 | $47.54 |
| Upper Range (P75) | $110,161 | $52.96 |
| Top Earners (P90) | $122,033 | $58.67 |
Median Salary Position
4.36% below the national average
2026 Salary Percentile Distribution in Sebring
In Sebring, FL, the occupational therapist salary spread from the 10th to 90th percentile is $46,006 (2026 est.). At $98,896, the local median is 4.36% below the national median of $103,400.
Salary Calculator
At 40 hours/week in Sebring: You'd be above the median
How Sebring Occupational Therapist Pay Compares
Sebring median: $98,896/year (2026)
| Compared To | Median Salary | Sebring Pays |
|---|---|---|
| Florida Average | $101,328 | -2.40% less |
| National Average | $103,400 | -4.36% less |
Occupational Therapists in Sebring, FL earn a median of $98,896 per year (2026 est.), which is 4.36% lower than the national median of $103,400 and 2.40% below the Florida state average of $101,328.
Cost-of-Living Adjusted Salary
Sebring has a cost of living 7.53% below the national average, meaning your salary goes further here.
Adjusted salary = nominal × (100 / CoL index). CoL index: 100 = national average.
Sebring, FL has a cost-of-living index of 92.47 (below the national average of 100). A occupational therapist earning $98,896 nominally has purchasing power equivalent to $106,949 in an average-cost city — an effective 8.14% boost.
Compare Purchasing Power
Select a city to see how your salary compares after cost of living
Select a city above to compare purchasing power
2019 BLS Actual
$81,250
2025 BLS Actual
$95,960
2026 Current Est.
$98,896
2019–2027 Growth
+25.4%
Salary Trajectory for Occupational Therapists in Sebring (2019–2027)
2019–2025: actual BLS OEWS data for this metro area. 2026+: CAGR 3.06% projection.
| Year | Annual Salary | Status |
|---|---|---|
| 2019 | $81,250 | Actual |
| 2020 | $82,522 | Actual |
| 2021 | $81,843 | Actual |
| 2022 | $89,121 | Actual |
| 2023 | $92,172 | Actual |
| 2024 | $94,130 | Actual |
| 2025 | $95,960 | Actual |
| 2026(current) | $98,896 | Estimated |
| 2027 | $101,923 | Projected |
Based on 7 years of BLS OEWS data for the Sebring metropolitan area, the median occupational therapist salary grew 18.1% from $81,250 (2019) to $95,960 (2025). At a 3.06% compound annual growth rate, salaries are projected to reach $101,923 by 2027 — a total increase of $20,673 (25.44%) from 2019.
Note: Historical values (2019–2025) are actual BLS OEWS figures for the Sebring metropolitan area, sourced from annual Occupational Employment and Wage Statistics surveys. 2026–2026 figures are current estimates, and 2027 values are projections, calculated using a 3.06% CAGR derived from 7-year BLS historical data. Actual salaries may vary based on employer, experience, certifications, and local market conditions.
Salary by Experience Level
| Experience | Estimated Salary Range |
|---|---|
| 0-2 years (New Graduate) | $76,027 – $84,076 |
| 3-5 years (Mid Career) | $84,076 – $98,896 |
| 5+ years (Experienced) | $98,896 – $110,161 |
| 10+ years (Top Earner) | $110,161 – $122,033 |
OT, OTR salary ranges estimated from BLS percentile data. Individual occupational therapist compensation varies by employer, certifications, and specialization.
Occupational Therapist Job Market in Sebring
The local job market for occupational therapists in Sebring is relatively strong with about 60 professionals currently employed in the area, which contributes to a competitive environment for available positions. The cost of living index stands at 92.47, suggesting that occupational therapist pay in Sebring, FL, provides a decent standard of living compared to national averages. More lucrative opportunities often exist within skilled nursing facilities and hospital inpatient rehabilitation settings, where salary scales tend to be higher than in educational environments. Factors such as productivity expectations, specialized certifications like the Certified Hand Therapist (CHT) designation, and the impact of Medicare cuts on various settings can drive the wage disparity seen amongst OTs. For those seeking to maximize their occupational therapist salary in Sebring, focusing on gaining additional certifications and targeting higher-paying roles may enhance earning potential significantly.
More salary data for Sebring, FL:
Frequently Asked Questions
How much do occupational therapists make in Sebring, FL in 2026?
Is Sebring, FL a good place to work as a occupational therapist?
Can occupational therapists make $100K in Sebring?
What is the cost-of-living adjusted occupational therapist salary in Sebring?
How much does a occupational therapist make per hour in Sebring?
Related Pages
Compare Salaries
Career Resources
Nearby Cities in Florida
Written by Jordan Miller, OTR/L
Career Analyst
Jordan has 10 years of experience in occupational therapy. They specialize in pediatrics and work in a rehabilitation clinic.
Methodology & Data Source
Salary figures on this page are 2026 projections based on the Bureau of Labor Statistics Occupational Employment and Wage Statistics (OEWS) survey, May 2026 release. The BLS reported a median annual salary of $95,960 for occupational therapistsin the Sebring metropolitan area. A 3.06% compound annual growth rate (CAGR), calculated from 6-year national BLS wage trends, was applied to project current 2026 compensation. Percentile ranges (P10–P90) represent the full salary distribution across experience levels and practice settings in this market.
Data Sources & Methodology
Source: BLS, OEWS, 2-year dataset (–). Per-city data from annual BLS metropolitan area surveys.
2026 figures are projected from 2025 BLS data using a compound annual growth rate (CAGR) of 3.06%, derived from historical BLS wage trends for occupational therapists (SOC 29-1122).
Compiled and verified by Jordan Miller, OTR/L, a licensed occupational therapist with 10+ years of clinical experience. · View source data at BLS.gov