Occupational Therapist Salary in Hawaii: $111,713 (2026)
Quick Answer:Across Hawaii's 10 metropolitan areas, the average median occupational therapist pay sits at $111,713/year heading into 2026 — a figure projected from 2025 BLS OEWS wage data for SOC 29-1122. Because Hawaii sits at BEA RPP 119.3 (19% above the U.S. baseline), that statewide median translates to roughly $93,640 in nationally-comparable purchasing power. Highest-paying metros: Honolulu ($127,363), Kaneohe ($118,941), Mililani Town ($118,727).
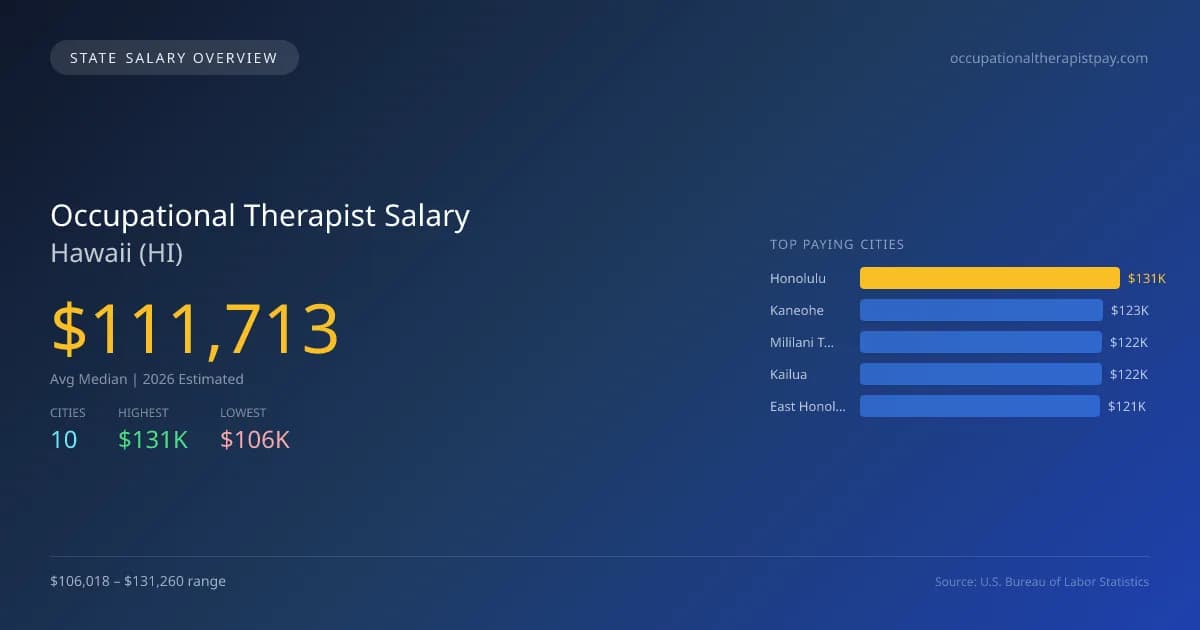
In 2026, the average median salary for occupational therapists in Hawaii is projected to be $111,713, which is 8.0% higher than the national median of $103,400. Honolulu is the highest-paying city in the state, with a salary of $131,260, while Urban Honolulu offers the lowest at $106,018. This salary gap can be attributed to varying costs of living and demand for occupational therapy services in different regions. Hawaii's occupational therapists must meet specific state licensing requirements and adhere to scope of practice laws, which can influence the job market. The demand for therapists in Hawaii is driven by factors such as an aging population and increased focus on rehabilitation services. The projected employment growth rate for occupational therapists in Hawaii is 3.06% annually, indicating a stable job market outlook. In addition to Honolulu, other cities like Kaneohe ($122,581), Mililani Town ($122,360), Kailua ($122,284), and East Honolulu ($120,924) also reflect healthy salary levels, reinforcing the need for skilled professionals in this field throughout the state. Overall, the landscape for occupational therapists in Hawaii remains favorable as opportunities continue to expand.
Hawaii Occupational Therapist Salary Range
Overall salary range in Hawaii: $80,346 (lowest entry-level) to $174,854 (highest top earner)
Hawaii vs National Average
Hawaii occupational therapists earn 8.04% more than the national median (+$8,313/year difference).
Hawaii Occupational Therapist Salary Distribution (2026)
Occupational Therapist salaries in Hawaii range from $82,308 (entry-level, 10th percentile) to $134,283 (top earners, 90th percentile), with a median of $111,713. The Hawaii median is $8,313 above the US national median of $103,400. The average hourly rate is $53.71/hr. Approximately 445 occupational therapists are employed across 10 cities.
2019 BLS Actual
$90,330
2025 BLS Actual
$108,396
2026 Current Est.
$111,713
2019–2027 Growth
+27.5%
Salary Trajectory for Occupational Therapists in Hawaii (2019–2027)
2019–2025: actual BLS OEWS data for this metro area. 2026+: CAGR 3.06% projection.
| Year | Annual Salary | Status |
|---|---|---|
| 2019 | $90,330 | Actual |
| 2020 | $89,440 | Actual |
| 2021 | $93,980 | Actual |
| 2022 | $97,230 | Actual |
| 2023 | $99,700 | Actual |
| 2024 | $101,460 | Actual |
| 2025 | $108,396 | Actual |
| 2026(current) | $111,713 | Estimated |
| 2027 | $115,131 | Projected |
Based on 7 years of BLS OEWS data for the Hawaii metropolitan area, the median occupational therapist salary grew 20.0% from $90,330 (2019) to $108,396 (2025). At a 3.06% compound annual growth rate, salaries are projected to reach $115,131 by 2027 — a total increase of $24,801 (27.46%) from 2019.
Note: Historical values (2019–2025) are actual BLS OEWS figures for the Hawaii metropolitan area, sourced from annual Occupational Employment and Wage Statistics surveys. 2026–2026 figures are current estimates, and 2027 values are projections, calculated using a 3.06% CAGR derived from 7-year BLS historical data. Actual salaries may vary based on employer, experience, certifications, and local market conditions.
Top 5 Highest Paying Cities in Hawaii
Lowest Paying Cities in Hawaii
| City | Median Salary |
|---|---|
| Urban Honolulu | $106,018 |
| Hilo | $117,057 |
| Kahului | $117,239 |
| Pearl City | $119,728 |
| Waipahu | $120,876 |
Best Value Cities for Occupational Therapists in Hawaii
When adjusted for local cost of living, these Hawaii cities offer the most purchasing power for occupational therapists.
| City | Nominal Salary | CoL Index | Adjusted Salary |
|---|---|---|---|
| Honolulu | $131,260 | 119.3 | $110,025 |
| Kaneohe | $122,581 | 119.3 | $102,750 |
| Mililani Town | $122,360 | 119.3 | $102,565 |
| Kailua | $122,284 | 119.3 | $102,501 |
| East Honolulu | $120,924 | 119.3 | $101,361 |
Adjusted salary = nominal salary × (100 / CoL index). CoL index: 100 = national average. Lower index = lower cost of living.
Salary by Experience Level in Hawaii
| Experience Level | Estimated Annual |
|---|---|
| Entry Level (0-2 years) | $82,308 |
| Mid Career (3-7 years) | $111,713 |
| Experienced (7+ years) | $134,283 |
Estimates based on BLS percentile data averaged across Hawaii metro areas. Individual pay varies by employer, certifications, and specialization.
All 10 Cities in Hawaii
| # | City | Median Salary |
|---|---|---|
| 1 | Honolulu | $131,260 |
| 2 | Kaneohe | $122,581 |
| 3 | Mililani Town | $122,360 |
| 4 | Kailua | $122,284 |
| 5 | East Honolulu | $120,924 |
| 6 | Waipahu | $120,876 |
| 7 | Pearl City | $119,728 |
| 8 | Kahului | $117,239 |
| 9 | Hilo | $117,057 |
| 10 | Urban Honolulu | $106,018 |
More Hawaii Salary Data
Hourly Rates
Explore occupational therapist hourly pay in Hawaii cities.
Senior / Experienced
Top earner salaries for experienced occupational therapists.
Explore More Occupational Therapist Salary Data
Frequently Asked Questions
How much do occupational therapists make in Hawaii in 2026?
What is the highest paying city for occupational therapists in Hawaii?
How does Hawaii occupational therapist pay compare to the national average?
What is the entry-level occupational therapist salary in Hawaii?
How many occupational therapists are employed in Hawaii?
Which Hawaii city offers the best value for occupational therapists?
Written by Jordan Miller, OTR/L
Career Analyst
Jordan has 10 years of experience in occupational therapy. They specialize in pediatrics and work in a rehabilitation clinic.
Methodology & Data Source
Statewide salary figures on this page are 2026 projections based on the Bureau of Labor Statistics Occupational Employment and Wage Statistics (OEWS) survey, May 2026 release. A 3.06% compound annual growth rate (CAGR), derived from 6-year national BLS wage trends, was applied to each metro area's reported salary to estimate current 2026 occupational therapist compensation across Hawaii. State averages are employment-weighted across 10 metro areas — larger metro areas with more occupational therapistscontribute proportionally more to the average, producing figures that better reflect typical compensation. Individual pay varies by city, employer, certifications, and experience.
Data Sources & Methodology
Source: BLS, OEWS, 7-year dataset (–). Per-city data from annual BLS metropolitan area surveys.
2026 figures are projected from 2025 BLS data using a compound annual growth rate (CAGR) of 3.06%, derived from historical BLS wage trends for occupational therapists (SOC 29-1122).
Compiled and verified by Jordan Miller, OTR/L, a licensed occupational therapist with 10+ years of clinical experience. · View source data at BLS.gov