Occupational Therapist Salary in Burlington, IA: $88,542 (2026)
Quick Answer:A full-time occupational therapist in Burlington, IA earns a median $88,542/year (≈ $42.56/hour) in nominal terms for 2026 — projected from BLS OEWS 2025 (SOC 29-1122). Once you factor in Burlington's price level (10% below national, BEA RPP 90.4), that paycheck buys what $97,945 would nationally. Nominal pay sits 4.0% below the Iowa state average.
Based on BLS state-level estimates · View source
In 2026, the projected median annual salary for occupational therapists in Burlington, IA, stands at $88,542, reflecting a competitive position compared to the national median of $103,400. This local figure showcases a salary range from $66,732 at the tenth percentile to $109,972 for those at the ninetieth percentile, indicating varying compensation based on experience and specialty. The salary structure in Burlington may be influenced by the types of settings where occupational therapists are employed, including hospital inpatient rehabilitation, schools, and skilled nursing facilities. Therapists working in these different environments often face trade-offs, such as balancing year-round employment in healthcare versus school-year contracts that may align with the academic calendar.
About the Burlington Market
Salary estimated from Iowa average ($82,000) adjusted for local cost of living.
Salary Breakdown
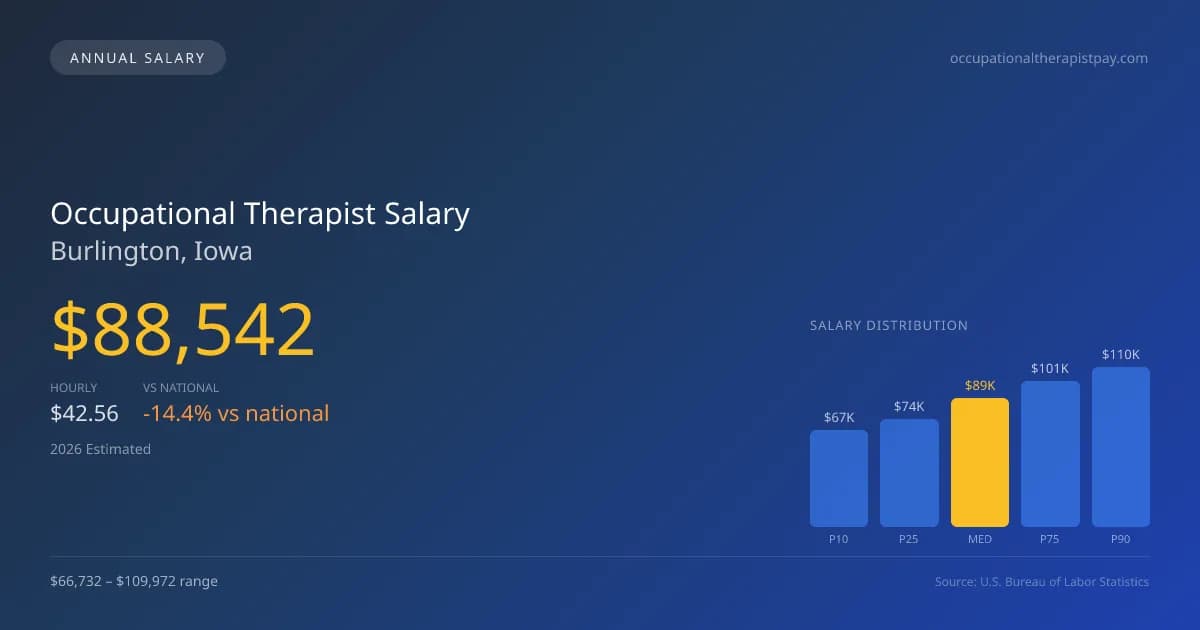
| Percentile | Annual | Hourly |
|---|---|---|
| Entry Level (P10) | $66,732 | $32.08 |
| Lower Range (P25) | $74,284 | $35.71 |
| Median (P50)(typical) | $88,542 | $42.56 |
| Upper Range (P75) | $100,522 | $48.32 |
| Top Earners (P90) | $109,972 | $52.87 |
Median Salary Position
14.37% below the national average
2026 Salary Percentile Distribution in Burlington
In Burlington, IA, the occupational therapist salary spread from the 10th to 90th percentile is $43,240 (2026 est.). At $88,542, the local median is 14.37% below the national median of $103,400.
Salary Calculator
At 40 hours/week in Burlington: You'd be above the median
How Burlington Occupational Therapist Pay Compares
Burlington median: $88,542/year (2026)
| Compared To | Median Salary | Burlington Pays |
|---|---|---|
| Iowa Average | $92,231 | -4.00% less |
| National Average | $103,400 | -14.37% less |
Occupational Therapists in Burlington, IA earn a median of $88,542 per year (2026 est.), which is 14.37% lower than the national median of $103,400 and 4.00% below the Iowa state average of $92,231.
Cost-of-Living Adjusted Salary
Burlington has a cost of living 9.60% below the national average, meaning your salary goes further here.
Adjusted salary = nominal × (100 / CoL index). CoL index: 100 = national average.
Burlington, IA has a cost-of-living index of 90.4 (below the national average of 100). A occupational therapist earning $88,542 nominally has purchasing power equivalent to $97,945 in an average-cost city — an effective 10.62% boost.
Compare Purchasing Power
Select a city to see how your salary compares after cost of living
Select a city above to compare purchasing power
2019 BLS Actual
$72,743
2025 BLS Actual
$85,913
2026 Current Est.
$88,542
2019–2027 Growth
+25.4%
Salary Trajectory for Occupational Therapists in Burlington (2019–2027)
2019–2025: actual BLS OEWS data for this metro area. 2026+: CAGR 3.06% projection.
| Year | Annual Salary | Status |
|---|---|---|
| 2019 | $72,743 | Actual |
| 2020 | $73,882 | Actual |
| 2021 | $73,274 | Actual |
| 2022 | $79,790 | Actual |
| 2023 | $82,522 | Actual |
| 2024 | $71,177 | Actual |
| 2025 | $85,913 | Actual |
| 2026(current) | $88,542 | Estimated |
| 2027 | $91,251 | Projected |
Based on 7 years of BLS OEWS data for the Burlington metropolitan area, the median occupational therapist salary grew 18.1% from $72,743 (2019) to $85,913 (2025). At a 3.06% compound annual growth rate, salaries are projected to reach $91,251 by 2027 — a total increase of $18,508 (25.44%) from 2019.
Note: Historical values (2019–2025) are actual BLS OEWS figures for the Burlington metropolitan area, sourced from annual Occupational Employment and Wage Statistics surveys. 2026–2026 figures are current estimates, and 2027 values are projections, calculated using a 3.06% CAGR derived from 7-year BLS historical data. Actual salaries may vary based on employer, experience, certifications, and local market conditions.
Salary by Experience Level
| Experience | Estimated Salary Range |
|---|---|
| 0-2 years (New Graduate) | $66,732 – $74,284 |
| 3-5 years (Mid Career) | $74,284 – $88,542 |
| 5+ years (Experienced) | $88,542 – $100,522 |
| 10+ years (Top Earner) | $100,522 – $109,972 |
OT, OTR salary ranges estimated from BLS percentile data. Individual occupational therapist compensation varies by employer, certifications, and specialization.
Occupational Therapist Job Market in Burlington
In terms of local job opportunities, Burlington currently employs four occupational therapists, suggesting a small but potentially supportive community for those entering the field. The cost of living index for the area, at 90.4, indicates that while salaries might be lower than the national average, the purchasing power is comparatively accessible for residents. Among the various employers, hospitals generally offer higher pay rates, followed by outpatient settings, while skilled nursing facilities might lag due to budget constraints and the impact of Medicare cuts. This salary spread arises from factors such as certification incentives like the Certified Hand Therapist (CHT) designation and productivity expectations set by employers. For those looking to maximize their occupational therapist pay in Burlington, pursuing specialized credentials can make a significant difference, as can opting for roles in higher-paying settings like hospitals or outpatient clinics.
More salary data for Burlington, IA:
Frequently Asked Questions
How much do occupational therapists make in Burlington, IA in 2026?
Is Burlington, IA a good place to work as a occupational therapist?
Can occupational therapists make $100K in Burlington?
What is the cost-of-living adjusted occupational therapist salary in Burlington?
How much does a occupational therapist make per hour in Burlington?
Related Pages
Compare Salaries
Career Resources
Written by Jordan Miller, OTR/L
Career Analyst
Jordan has 10 years of experience in occupational therapy. They specialize in pediatrics and work in a rehabilitation clinic.
Methodology & Data Source
Salary figures on this page are 2026 projections based on the Bureau of Labor Statistics Occupational Employment and Wage Statistics (OEWS) survey, May 2026 release. The BLS reported a median annual salary of $85,913 for occupational therapistsin the Burlington metropolitan area. A 3.06% compound annual growth rate (CAGR), calculated from 6-year national BLS wage trends, was applied to project current 2026 compensation. Percentile ranges (P10–P90) represent the full salary distribution across experience levels and practice settings in this market.
Data Sources & Methodology
Salary data for Burlington is estimated from official BLS state-level occupational wage data (2025), adjusted for regional cost-of-living differences using BEA RPP (Regional Price Parities).
2026 figures are projected from 2025 BLS data using a compound annual growth rate (CAGR) of 3.06%, derived from historical BLS wage trends for occupational therapists (SOC 29-1122).
Compiled and verified by Jordan Miller, OTR/L, a licensed occupational therapist with 10+ years of clinical experience. · View source data at BLS.gov