Occupational Therapist Salary in Kansas: $99,069 (2026)
Quick Answer:Across Kansas's 22 metropolitan areas, the average median occupational therapist pay sits at $99,069/year heading into 2026 — a figure projected from 2025 BLS OEWS wage data for SOC 29-1122. Because Kansas sits at BEA RPP 90.9 (9% below the U.S. baseline), that statewide median translates to roughly $108,987 in nationally-comparable purchasing power. Highest-paying metros: Lawrence ($101,060), Kansas City ($100,475), Topeka ($99,070).
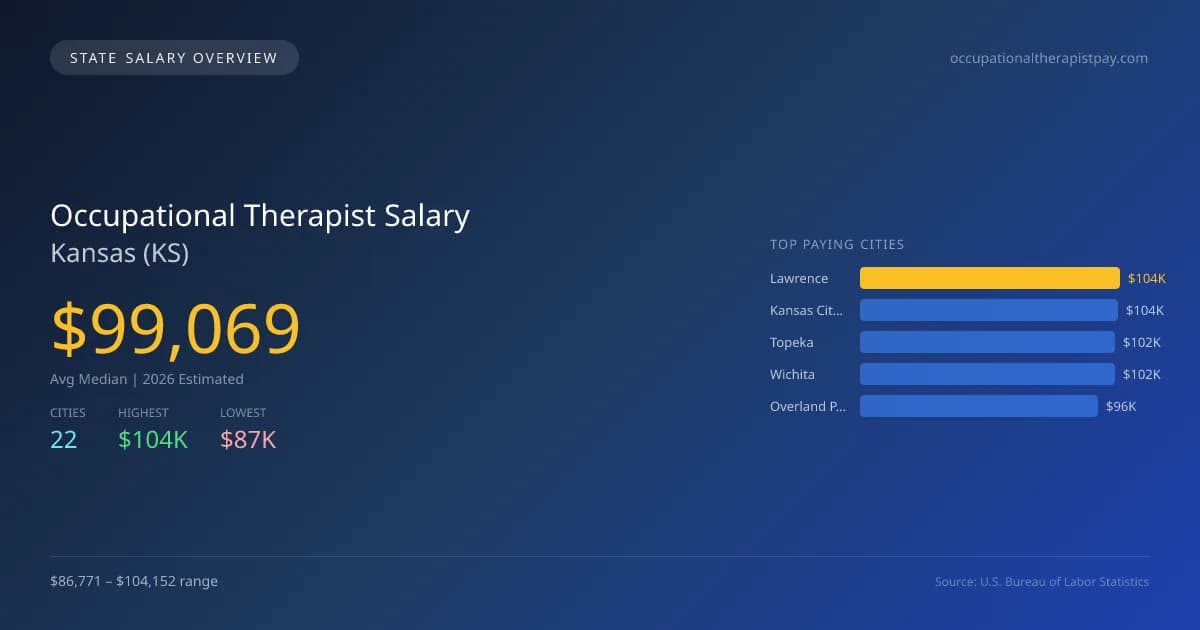
In Kansas, the projected average median salary for occupational therapists in 2026 is $99,068, which is about 4.2% lower than the national median of $103,400. The highest-paying city in the state is Lawrence, with a projected salary of $104,152, while Emporia has the lowest at $86,771, creating a salary gap of $17,381. Factors influencing this difference include local demand, cost of living, and the presence of healthcare facilities. Kansas has specific state licensing requirements and scope of practice laws that may vary from other states, impacting how occupational therapy is delivered and compensated. The job market for occupational therapists in the state is expected to grow at an annual rate of 3.06%, indicating steady demand for professionals in this field. Key cities driving this growth include Kansas City at $103,550, Topeka at $102,102, Wichita at $102,029, and Overland Park at $95,526. Overall, the outlook for occupational therapists in Kansas appears positive, with sufficient opportunities distributed across various metropolitan areas.
Kansas Occupational Therapist Salary Range
Overall salary range in Kansas: $64,439 (lowest entry-level) to $136,365 (highest top earner)
Kansas vs National Average
Kansas occupational therapists earn 4.19% less than the national median ($-4,331/year difference).
Kansas Occupational Therapist Salary Distribution (2026)
Occupational Therapist salaries in Kansas range from $72,623 (entry-level, 10th percentile) to $123,731 (top earners, 90th percentile), with a median of $99,069. The Kansas median is $4,331 below the US national median of $103,400. The average hourly rate is $47.63/hr. Approximately 751 occupational therapists are employed across 22 cities.
2019 BLS Actual
$86,916
2025 BLS Actual
$96,127
2026 Current Est.
$99,069
2019–2027 Growth
+17.5%
Salary Trajectory for Occupational Therapists in Kansas (2019–2027)
2019–2025: actual BLS OEWS data for this metro area. 2026+: CAGR 3.06% projection.
| Year | Annual Salary | Status |
|---|---|---|
| 2019 | $86,916 | Actual |
| 2020 | $90,650 | Actual |
| 2021 | $86,493 | Actual |
| 2022 | $84,844 | Actual |
| 2023 | $90,084 | Actual |
| 2024 | $89,812 | Actual |
| 2025 | $96,127 | Actual |
| 2026(current) | $99,069 | Estimated |
| 2027 | $102,100 | Projected |
Based on 7 years of BLS OEWS data for the Kansas metropolitan area, the median occupational therapist salary grew 10.6% from $86,916 (2019) to $96,127 (2025). At a 3.06% compound annual growth rate, salaries are projected to reach $102,100 by 2027 — a total increase of $15,184 (17.47%) from 2019.
Note: Historical values (2019–2025) are actual BLS OEWS figures for the Kansas metropolitan area, sourced from annual Occupational Employment and Wage Statistics surveys. 2026–2026 figures are current estimates, and 2027 values are projections, calculated using a 3.06% CAGR derived from 7-year BLS historical data. Actual salaries may vary based on employer, experience, certifications, and local market conditions.
Top 5 Highest Paying Cities in Kansas
Lowest Paying Cities in Kansas
| City | Median Salary |
|---|---|
| Emporia | $86,771 |
| Gardner | $87,160 |
| Liberal | $87,662 |
| Hays | $88,002 |
| Prairie Village | $88,263 |
Best Value Cities for Occupational Therapists in Kansas
When adjusted for local cost of living, these Kansas cities offer the most purchasing power for occupational therapists.
| City | Nominal Salary | CoL Index | Adjusted Salary |
|---|---|---|---|
| Lawrence | $104,152 | 90.243 | $115,413 |
| Topeka | $102,102 | 88.82 | $114,954 |
| Wichita | $102,029 | 88.946 | $114,709 |
| Kansas City | $103,550 | 90.9 | $113,916 |
| Overland Park | $95,526 | 90.9 | $105,089 |
Adjusted salary = nominal salary × (100 / CoL index). CoL index: 100 = national average. Lower index = lower cost of living.
Salary by Experience Level in Kansas
| Experience Level | Estimated Annual |
|---|---|
| Entry Level (0-2 years) | $72,623 |
| Mid Career (3-7 years) | $99,069 |
| Experienced (7+ years) | $123,731 |
Estimates based on BLS percentile data averaged across Kansas metro areas. Individual pay varies by employer, certifications, and specialization.
All 22 Cities in Kansas
| # | City | Median Salary |
|---|---|---|
| 1 | Lawrence | $104,152 |
| 2 | Kansas City | $103,550 |
| 3 | Topeka | $102,102 |
| 4 | Wichita | $102,029 |
| 5 | Overland Park | $95,526 |
| 6 | Olathe | $94,311 |
| 7 | Lenexa | $94,081 |
| 8 | Garden City | $93,151 |
| 9 | Derby | $92,685 |
| 10 | Hutchinson | $91,948 |
| 11 | Leavenworth | $91,918 |
| 12 | Shawnee | $91,625 |
| 13 | Manhattan | $91,321 |
| 14 | Salina | $90,948 |
| 15 | Leawood | $90,445 |
| 16 | Dodge City | $88,921 |
| 17 | Junction City | $88,638 |
| 18 | Prairie Village | $88,263 |
| 19 | Hays | $88,002 |
| 20 | Liberal | $87,662 |
| 21 | Gardner | $87,160 |
| 22 | Emporia | $86,771 |
More Kansas Salary Data
Hourly Rates
Explore occupational therapist hourly pay in Kansas cities.
Senior / Experienced
Top earner salaries for experienced occupational therapists.
Explore More Occupational Therapist Salary Data
Frequently Asked Questions
How much do occupational therapists make in Kansas in 2026?
What is the highest paying city for occupational therapists in Kansas?
How does Kansas occupational therapist pay compare to the national average?
What is the entry-level occupational therapist salary in Kansas?
How many occupational therapists are employed in Kansas?
Which Kansas city offers the best value for occupational therapists?
Written by Jordan Miller, OTR/L
Career Analyst
Jordan has 10 years of experience in occupational therapy. They specialize in pediatrics and work in a rehabilitation clinic.
Methodology & Data Source
Statewide salary figures on this page are 2026 projections based on the Bureau of Labor Statistics Occupational Employment and Wage Statistics (OEWS) survey, May 2026 release. A 3.06% compound annual growth rate (CAGR), derived from 6-year national BLS wage trends, was applied to each metro area's reported salary to estimate current 2026 occupational therapist compensation across Kansas. State averages are employment-weighted across 22 metro areas — larger metro areas with more occupational therapistscontribute proportionally more to the average, producing figures that better reflect typical compensation. Individual pay varies by city, employer, certifications, and experience.
Data Sources & Methodology
Source: BLS, OEWS, 7-year dataset (–). Per-city data from annual BLS metropolitan area surveys.
2026 figures are projected from 2025 BLS data using a compound annual growth rate (CAGR) of 3.06%, derived from historical BLS wage trends for occupational therapists (SOC 29-1122).
Compiled and verified by Jordan Miller, OTR/L, a licensed occupational therapist with 10+ years of clinical experience. · View source data at BLS.gov