Occupational Therapist Salary in Nebraska: $96,426 (2026)
Quick Answer:Across Nebraska's 13 metropolitan areas, the average median occupational therapist pay sits at $96,426/year heading into 2026 — a figure projected from 2025 BLS OEWS wage data for SOC 29-1122. Because Nebraska sits at BEA RPP 91.5 (8% below the U.S. baseline), that statewide median translates to roughly $105,384 in nationally-comparable purchasing power. Highest-paying metros: Lincoln ($96,320), Omaha ($93,650), Hastings ($89,564).
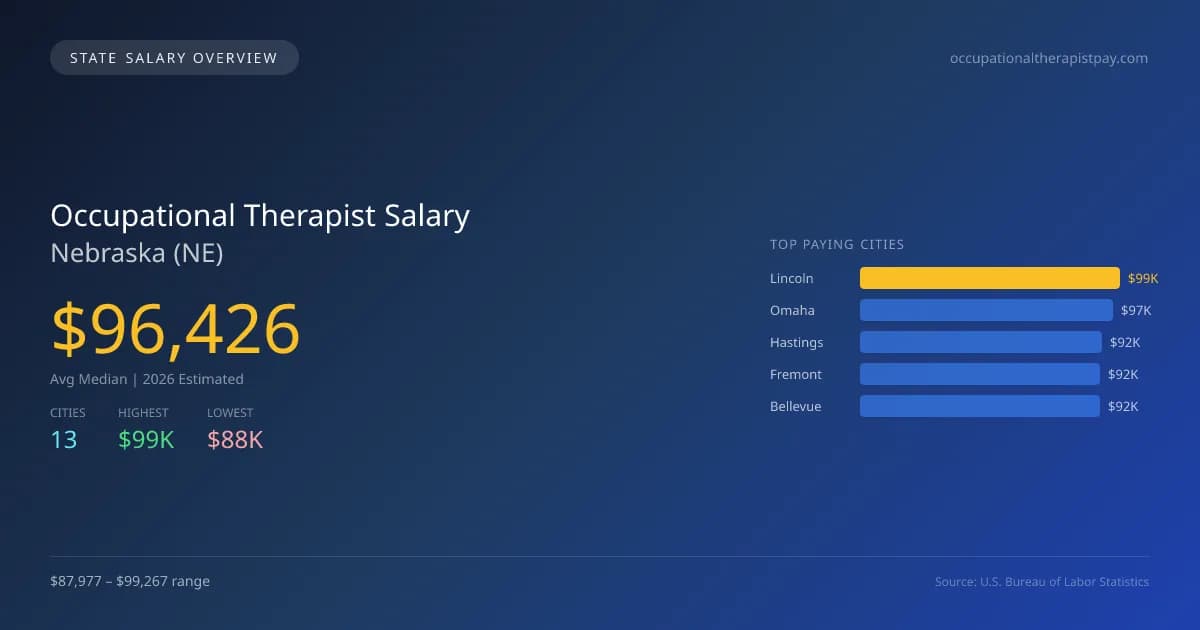
In 2026, the average median salary for occupational therapists in Nebraska is projected to be $96,426, which is 6.7% lower than the national median of $103,400. This highlights a moderate wage gap, which can vary significantly within the state. Lincoln, the highest-paying city, offers $99,267, while North Platte, the lowest-paying city, provides $87,977. The disparity between these salaries is influenced by factors such as the cost of living, demand for services, and the availability of positions in urban versus rural areas. Nebraska has specific licensing requirements for occupational therapists, which include obtaining a state license following national certification. The scope of practice laws in the state are aligned with national standards, ensuring that practitioners can operate effectively. The job market for occupational therapists in Nebraska is expected to grow at an annual rate of 3.06% through 2026, indicating a steady demand for professionals in this field. As awareness of the importance of rehabilitation services increases, opportunities are likely to expand, providing a positive outlook for those entering the profession. Major cities like Omaha, Hastings, Fremont, and Bellevue also reflect varying salaries, with Omaha projecting $96,516, Hastings at $92,305, Fremont at $91,806, and Bellevue at $91,615.
Nebraska Occupational Therapist Salary Range
Overall salary range in Nebraska: $64,242 (lowest entry-level) to $136,524 (highest top earner)
Nebraska vs National Average
Nebraska occupational therapists earn 6.74% less than the national median ($-6,974/year difference).
Nebraska Occupational Therapist Salary Distribution (2026)
Occupational Therapist salaries in Nebraska range from $71,871 (entry-level, 10th percentile) to $116,318 (top earners, 90th percentile), with a median of $96,426. The Nebraska median is $6,974 below the US national median of $103,400. The average hourly rate is $46.36/hr. Approximately 1,192 occupational therapists are employed across 13 cities.
2019 BLS Actual
$75,505
2025 BLS Actual
$93,563
2026 Current Est.
$96,426
2019–2027 Growth
+31.6%
Salary Trajectory for Occupational Therapists in Nebraska (2019–2027)
2019–2025: actual BLS OEWS data for this metro area. 2026+: CAGR 3.06% projection.
| Year | Annual Salary | Status |
|---|---|---|
| 2019 | $75,505 | Actual |
| 2020 | $77,870 | Actual |
| 2021 | $78,302 | Actual |
| 2022 | $83,014 | Actual |
| 2023 | $84,376 | Actual |
| 2024 | $85,017 | Actual |
| 2025 | $93,563 | Actual |
| 2026(current) | $96,426 | Estimated |
| 2027 | $99,377 | Projected |
Based on 7 years of BLS OEWS data for the Nebraska metropolitan area, the median occupational therapist salary grew 23.9% from $75,505 (2019) to $93,563 (2025). At a 3.06% compound annual growth rate, salaries are projected to reach $99,377 by 2027 — a total increase of $23,872 (31.62%) from 2019.
Note: Historical values (2019–2025) are actual BLS OEWS figures for the Nebraska metropolitan area, sourced from annual Occupational Employment and Wage Statistics surveys. 2026–2026 figures are current estimates, and 2027 values are projections, calculated using a 3.06% CAGR derived from 7-year BLS historical data. Actual salaries may vary based on employer, experience, certifications, and local market conditions.
Top 5 Highest Paying Cities in Nebraska
Lowest Paying Cities in Nebraska
| City | Median Salary |
|---|---|
| North Platte | $87,977 |
| Papillion | $88,006 |
| La Vista | $88,099 |
| Norfolk | $88,113 |
| Columbus | $88,347 |
Best Value Cities for Occupational Therapists in Nebraska
When adjusted for local cost of living, these Nebraska cities offer the most purchasing power for occupational therapists.
| City | Nominal Salary | CoL Index | Adjusted Salary |
|---|---|---|---|
| Lincoln | $99,267 | 91.581 | $108,393 |
| Omaha | $96,516 | 91.911 | $105,010 |
| Grand Island | $89,858 | 86.657 | $103,694 |
| Hastings | $92,305 | 91.5 | $100,880 |
| Fremont | $91,806 | 91.5 | $100,334 |
Adjusted salary = nominal salary × (100 / CoL index). CoL index: 100 = national average. Lower index = lower cost of living.
Salary by Experience Level in Nebraska
| Experience Level | Estimated Annual |
|---|---|
| Entry Level (0-2 years) | $71,871 |
| Mid Career (3-7 years) | $96,426 |
| Experienced (7+ years) | $116,318 |
Estimates based on BLS percentile data averaged across Nebraska metro areas. Individual pay varies by employer, certifications, and specialization.
All 13 Cities in Nebraska
| # | City | Median Salary |
|---|---|---|
| 1 | Lincoln | $99,267 |
| 2 | Omaha | $96,516 |
| 3 | Hastings | $92,305 |
| 4 | Fremont | $91,806 |
| 5 | Bellevue | $91,615 |
| 6 | Kearney | $91,108 |
| 7 | Scottsbluff | $90,795 |
| 8 | Grand Island | $89,858 |
| 9 | Columbus | $88,347 |
| 10 | Norfolk | $88,113 |
| 11 | La Vista | $88,099 |
| 12 | Papillion | $88,006 |
| 13 | North Platte | $87,977 |
More Nebraska Salary Data
Senior / Experienced
Top earner salaries for experienced occupational therapists.
Explore More Occupational Therapist Salary Data
Frequently Asked Questions
How much do occupational therapists make in Nebraska in 2026?
What is the highest paying city for occupational therapists in Nebraska?
How does Nebraska occupational therapist pay compare to the national average?
What is the entry-level occupational therapist salary in Nebraska?
How many occupational therapists are employed in Nebraska?
Which Nebraska city offers the best value for occupational therapists?
Written by Jordan Miller, OTR/L
Career Analyst
Jordan has 10 years of experience in occupational therapy. They specialize in pediatrics and work in a rehabilitation clinic.
Methodology & Data Source
Statewide salary figures on this page are 2026 projections based on the Bureau of Labor Statistics Occupational Employment and Wage Statistics (OEWS) survey, May 2026 release. A 3.06% compound annual growth rate (CAGR), derived from 6-year national BLS wage trends, was applied to each metro area's reported salary to estimate current 2026 occupational therapist compensation across Nebraska. State averages are employment-weighted across 13 metro areas — larger metro areas with more occupational therapistscontribute proportionally more to the average, producing figures that better reflect typical compensation. Individual pay varies by city, employer, certifications, and experience.
Data Sources & Methodology
Source: BLS, OEWS, 7-year dataset (–). Per-city data from annual BLS metropolitan area surveys.
2026 figures are projected from 2025 BLS data using a compound annual growth rate (CAGR) of 3.06%, derived from historical BLS wage trends for occupational therapists (SOC 29-1122).
Compiled and verified by Jordan Miller, OTR/L, a licensed occupational therapist with 10+ years of clinical experience. · View source data at BLS.gov