Occupational Therapist Salary in Fernley, NV: $93,949 (2026)
Quick Answer:A full-time occupational therapist in Fernley, NV earns a median $93,949/year (≈ $45.17/hour) in nominal terms for 2026 — projected from BLS OEWS 2025 (SOC 29-1122). Once you factor in Fernley's price level (2% below national, BEA RPP 98.3), that paycheck buys what $95,574 would nationally. Nominal pay sits 7.6% below the Nevada state average.
Based on BLS state-level estimates · View source
Occupational therapists in Fernley, NV, can expect a median annual salary of $93,949 in 2026, which reflects the unique dynamics of the local job market. The full salary range for this profession extends from $73,111 at the 10th percentile to $118,781 at the 90th percentile. Local estimates, derived from 2025 BLS data and adjusted for regional pricing, show that occupational therapist pay in Fernley is approximately 9.14% lower than the national median of $103,400. The choice between working in schools, skilled nursing facilities (SNFs), or hospitals significantly influences this pay structure, particularly given the differences in employment settings and the year-round versus school-year contracts that can affect income stability and growth potential in this city.
About the Fernley Market
Salary estimated from Nevada average ($108,000) adjusted for local cost of living.
Salary Breakdown
| Percentile | Annual | Hourly |
|---|---|---|
| Entry Level (P10) | $73,111 | $35.15 |
| Lower Range (P25) | $80,197 | $38.55 |
| Median (P50)(typical) | $93,949 | $45.17 |
| Upper Range (P75) | $107,955 | $51.90 |
| Top Earners (P90) | $118,781 | $57.11 |
Median Salary Position
9.14% below the national average
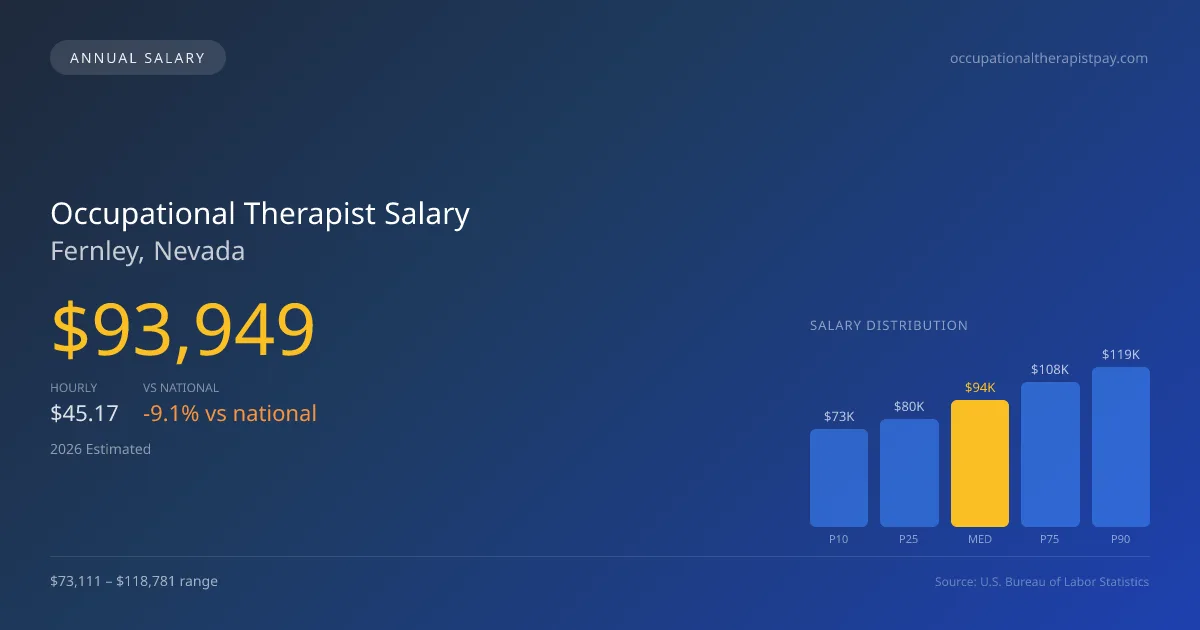
2026 Salary Percentile Distribution in Fernley
In Fernley, NV, the occupational therapist salary spread from the 10th to 90th percentile is $45,670 (2026 est.). At $93,949, the local median is 9.14% below the national median of $103,400.
Salary Calculator
At 40 hours/week in Fernley: You'd be in the lower-middle range
How Fernley Occupational Therapist Pay Compares
Fernley median: $93,949/year (2026)
| Compared To | Median Salary | Fernley Pays |
|---|---|---|
| Nevada Average | $101,677 | -7.60% less |
| National Average | $103,400 | -9.14% less |
Occupational Therapists in Fernley, NV earn a median of $93,949 per year (2026 est.), which is 9.14% lower than the national median of $103,400 and 7.60% below the Nevada state average of $101,677.
Cost-of-Living Adjusted Salary
Fernley has a cost of living 1.70% below the national average, meaning your salary goes further here.
Adjusted salary = nominal × (100 / CoL index). CoL index: 100 = national average.
Fernley, NV has a cost-of-living index of 98.3 (below the national average of 100). A occupational therapist earning $93,949 nominally has purchasing power equivalent to $95,574 in an average-cost city — an effective 1.73% boost.
Compare Purchasing Power
Select a city to see how your salary compares after cost of living
Select a city above to compare purchasing power
2019 BLS Actual
$77,186
2025 BLS Actual
$91,160
2026 Current Est.
$93,949
2019–2027 Growth
+25.4%
Salary Trajectory for Occupational Therapists in Fernley (2019–2027)
2019–2025: actual BLS OEWS data for this metro area. 2026+: CAGR 3.06% projection.
| Year | Annual Salary | Status |
|---|---|---|
| 2019 | $77,186 | Actual |
| 2020 | $78,394 | Actual |
| 2021 | $77,749 | Actual |
| 2022 | $84,663 | Actual |
| 2023 | $87,562 | Actual |
| 2024 | $98,130 | Actual |
| 2025 | $91,160 | Actual |
| 2026(current) | $93,949 | Estimated |
| 2027 | $96,824 | Projected |
Based on 7 years of BLS OEWS data for the Fernley metropolitan area, the median occupational therapist salary grew 18.1% from $77,186 (2019) to $91,160 (2025). At a 3.06% compound annual growth rate, salaries are projected to reach $96,824 by 2027 — a total increase of $19,638 (25.44%) from 2019.
Note: Historical values (2019–2025) are actual BLS OEWS figures for the Fernley metropolitan area, sourced from annual Occupational Employment and Wage Statistics surveys. 2026–2026 figures are current estimates, and 2027 values are projections, calculated using a 3.06% CAGR derived from 7-year BLS historical data. Actual salaries may vary based on employer, experience, certifications, and local market conditions.
Salary by Experience Level
| Experience | Estimated Salary Range |
|---|---|
| 0-2 years (New Graduate) | $73,111 – $80,197 |
| 3-5 years (Mid Career) | $80,197 – $93,949 |
| 5+ years (Experienced) | $93,949 – $107,955 |
| 10+ years (Top Earner) | $107,955 – $118,781 |
OT, OTR salary ranges estimated from BLS percentile data. Individual occupational therapist compensation varies by employer, certifications, and specialization.
Occupational Therapist Job Market in Fernley
In terms of the local job market, Fernley currently employs six occupational therapists, a relatively small number that may limit competition but also indicates a niche market. The cost of living index in the area stands at 98.3, suggesting that the purchasing power for occupational therapists is modestly favorable, albeit slightly below national averages. Among potential employers, skilled nursing facilities and hospital inpatient rehab units typically offer the highest salaries. Differences in compensation arise from factors such as productivity expectations, specialty certifications (like the Certified Hand Therapist credential), and the implications of Medicare cuts, particularly for outpatient services. To maximize earning potential in Fernley, therapists should consider pursuing additional credentials and focusing on settings like hospitals or specialized clinics that prioritize higher reimbursement rates, while weighing the long-term benefits of stability against the variability of school-based positions.
More salary data for Fernley, NV:
Frequently Asked Questions
How much do occupational therapists make in Fernley, NV in 2026?
Is Fernley, NV a good place to work as a occupational therapist?
Can occupational therapists make $100K in Fernley?
What is the cost-of-living adjusted occupational therapist salary in Fernley?
How much does a occupational therapist make per hour in Fernley?
Related Pages
Compare Salaries
Career Resources
Nearby Cities in Nevada
Written by Jordan Miller, OTR/L
Career Analyst
Jordan has 10 years of experience in occupational therapy. They specialize in pediatrics and work in a rehabilitation clinic.
Methodology & Data Source
Salary figures on this page are 2026 projections based on the Bureau of Labor Statistics Occupational Employment and Wage Statistics (OEWS) survey, May 2026 release. The BLS reported a median annual salary of $91,160 for occupational therapistsin the Fernley metropolitan area. A 3.06% compound annual growth rate (CAGR), calculated from 6-year national BLS wage trends, was applied to project current 2026 compensation. Percentile ranges (P10–P90) represent the full salary distribution across experience levels and practice settings in this market.
Data Sources & Methodology
Salary data for Fernley is estimated from official BLS state-level occupational wage data (2025), adjusted for regional cost-of-living differences using BEA RPP (Regional Price Parities).
2026 figures are projected from 2025 BLS data using a compound annual growth rate (CAGR) of 3.06%, derived from historical BLS wage trends for occupational therapists (SOC 29-1122).
Compiled and verified by Jordan Miller, OTR/L, a licensed occupational therapist with 10+ years of clinical experience. · View source data at BLS.gov