Occupational Therapist Salary in Manchester, NH: $86,076 (2026)
Quick Answer:A full-time occupational therapist in Manchester, NH earns a median $86,076/year (≈ $41.39/hour) in nominal terms for 2026 — projected from BLS OEWS 2025 (SOC 29-1122). Once you factor in Manchester's price level (6% above national, BEA RPP 105.7), that paycheck buys what $81,467 would nationally. Nominal pay sits 22.4% below the New Hampshire state average.
Official BLS data · View source
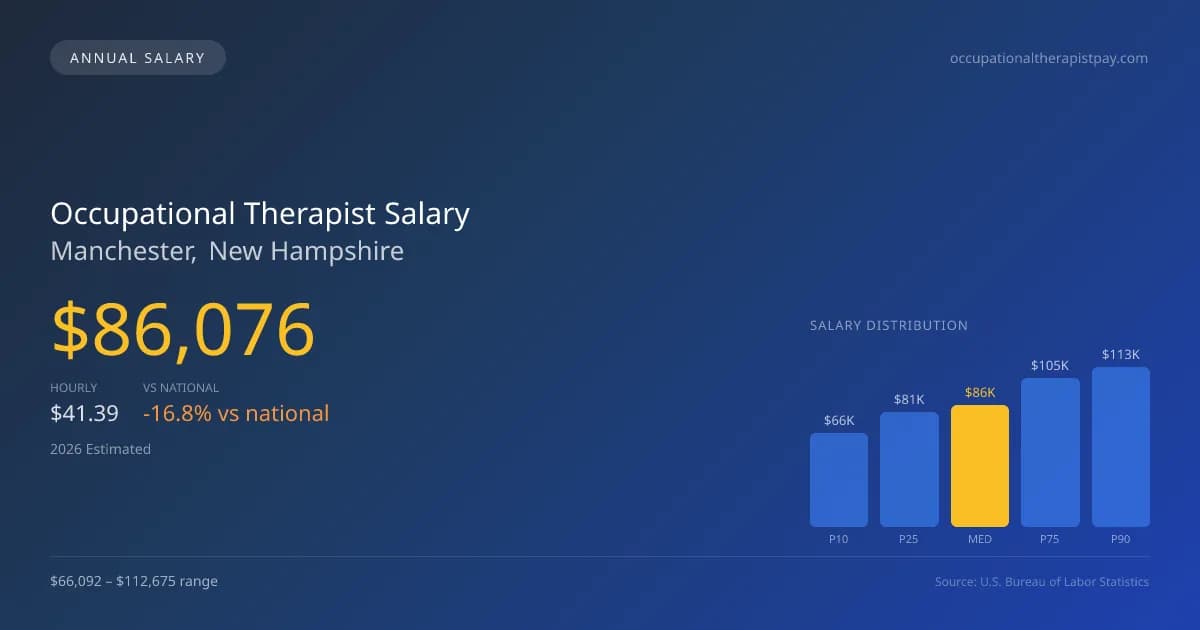
Occupational therapists in Manchester, New Hampshire, can expect a median annual salary of $86,076 in 2026, significantly lower than the national median of $103,400. The salary range for this profession is projected to span from $66,092 at the 10th percentile to $112,675 at the 90th percentile. This data, derived from 2025 BLS OEWS surveys, reflects the current economic climate in healthcare, particularly following Medicare cuts that have affected compensation in skilled nursing facilities (SNFs) and outpatient therapy settings. Given the projected growth rate of 3.06%, the job market for occupational therapists in Manchester appears stable despite the pressure from these reimbursement changes, ensuring ongoing demand in both clinical and rehabilitation environments.
Salary Breakdown
| Percentile | Annual | Hourly |
|---|---|---|
| Entry Level (P10) | $66,092 | $31.77 |
| Lower Range (P25) | $81,242 | $39.06 |
| Median (P50)(typical) | $86,076 | $41.39 |
| Upper Range (P75) | $104,864 | $50.42 |
| Top Earners (P90) | $112,675 | $54.17 |
Median Salary Position
16.75% below the national average
2026 Salary Percentile Distribution in Manchester
In Manchester, NH, the occupational therapist salary spread from the 10th to 90th percentile is $46,583 (2026 est.). At $86,076, the local median is 16.75% below the national median of $103,400.
Salary Calculator
At 40 hours/week in Manchester: You'd be in the lower-middle range
How Manchester Occupational Therapist Pay Compares
Manchester median: $86,076/year (2026)
| Compared To | Median Salary | Manchester Pays |
|---|---|---|
| New Hampshire Average | $110,922 | -22.40% less |
| National Average | $103,400 | -16.75% less |
Occupational Therapists in Manchester, NH earn a median of $86,076 per year (2026 est.), which is 16.75% lower than the national median of $103,400 and 22.40% below the New Hampshire state average of $110,922.
Cost-of-Living Adjusted Salary
Manchester has a cost of living 5.66% above the national average.
Adjusted salary = nominal × (100 / CoL index). CoL index: 100 = national average.
Manchester, NH has a cost-of-living index of 105.657 (above the national average of 100). While the nominal salary of $86,076 is competitive, the higher cost of living reduces purchasing power to an effective $81,467 — a 5.35% reduction.
Compare Purchasing Power
Select a city to see how your salary compares after cost of living
Select a city above to compare purchasing power
2019 BLS Actual
$84,000
2025 BLS Actual
$83,520
2026 Current Est.
$86,076
2019–2027 Growth
+5.6%
Salary Trajectory for Occupational Therapists in Manchester (2019–2027)
2019–2025: actual BLS OEWS data for this metro area. 2026+: CAGR 3.06% projection.
| Year | Annual Salary | Status |
|---|---|---|
| 2019 | $84,000 | Actual |
| 2020 | $83,680 | Actual |
| 2021 | $80,450 | Actual |
| 2022 | $83,200 | Actual |
| 2023 | $90,410 | Actual |
| 2024 | $81,980 | Actual |
| 2025 | $83,520 | Actual |
| 2026(current) | $86,076 | Estimated |
| 2027 | $88,710 | Projected |
Based on 7 years of BLS OEWS data for the Manchester metropolitan area, the median occupational therapist salary grew -0.6% from $84,000 (2019) to $83,520 (2025). At a 3.06% compound annual growth rate, salaries are projected to reach $88,710 by 2027 — a total increase of $4,710 (5.61%) from 2019.
Note: Historical values (2019–2025) are actual BLS OEWS figures for the Manchester metropolitan area, sourced from annual Occupational Employment and Wage Statistics surveys. 2026–2026 figures are current estimates, and 2027 values are projections, calculated using a 3.06% CAGR derived from 7-year BLS historical data. Actual salaries may vary based on employer, experience, certifications, and local market conditions.
Salary by Experience Level
| Experience | Estimated Salary Range |
|---|---|
| 0-2 years (New Graduate) | $66,092 – $81,242 |
| 3-5 years (Mid Career) | $81,242 – $86,076 |
| 5+ years (Experienced) | $86,076 – $104,864 |
| 10+ years (Top Earner) | $104,864 – $112,675 |
OT, OTR salary ranges estimated from BLS percentile data. Individual occupational therapist compensation varies by employer, certifications, and specialization.
Occupational Therapist Job Market in Manchester
Focusing on the local job market, there are currently about 400 occupational therapists employed in Manchester, NH. However, the cost of living index stands at 105.657, which exceeds the national average and affects take-home purchasing power. Employers that tend to offer higher salaries include hospital inpatient rehabilitation settings and skilled nursing facilities, while school districts often pay less due to shorter contract terms. Factors contributing to the variation in pay include productivity expectations and certifications such as the Certified Hand Therapist (CHT) credential. To maximize occupational therapist pay in Manchester, NH, professionals should consider pursuing board certifications and seek opportunities in higher-paying environments like hospitals or home health agencies, moving towards roles that offer year-round employment to optimize salary potential.
More salary data for Manchester, NH:
Frequently Asked Questions
How much do occupational therapists make in Manchester, NH in 2026?
Is Manchester, NH a good place to work as a occupational therapist?
Can occupational therapists make $100K in Manchester?
What is the cost-of-living adjusted occupational therapist salary in Manchester?
How much does a occupational therapist make per hour in Manchester?
Related Pages
Compare Salaries
Career Resources
Nearby Cities in New Hampshire
Written by Jordan Miller, OTR/L
Career Analyst
Jordan has 10 years of experience in occupational therapy. They specialize in pediatrics and work in a rehabilitation clinic.
Methodology & Data Source
Salary figures on this page are 2026 projections based on the Bureau of Labor Statistics Occupational Employment and Wage Statistics (OEWS) survey, May 2026 release. The BLS reported a median annual salary of $83,520 for occupational therapistsin the Manchester metropolitan area. A 3.06% compound annual growth rate (CAGR), calculated from 6-year national BLS wage trends, was applied to project current 2026 compensation. Percentile ranges (P10–P90) represent the full salary distribution across experience levels and practice settings in this market.
Data Sources & Methodology
Source: BLS, OEWS, 7-year dataset (–). Per-city data from annual BLS metropolitan area surveys.
2026 figures are projected from 2025 BLS data using a compound annual growth rate (CAGR) of 3.06%, derived from historical BLS wage trends for occupational therapists (SOC 29-1122).
Compiled and verified by Jordan Miller, OTR/L, a licensed occupational therapist with 10+ years of clinical experience. · View source data at BLS.gov