Occupational Therapist Salary in Tulsa, OK: $111,666 (2026)
Quick Answer:A full-time occupational therapist in Tulsa, OK earns a median $111,666/year (≈ $53.68/hour) in nominal terms for 2026 — projected from BLS OEWS 2025 (SOC 29-1122). Once you factor in Tulsa's price level (11% below national, BEA RPP 89.2), that paycheck buys what $125,166 would nationally. Nominal pay sits 21.5% above the Oklahoma state average.
Official BLS data · View source
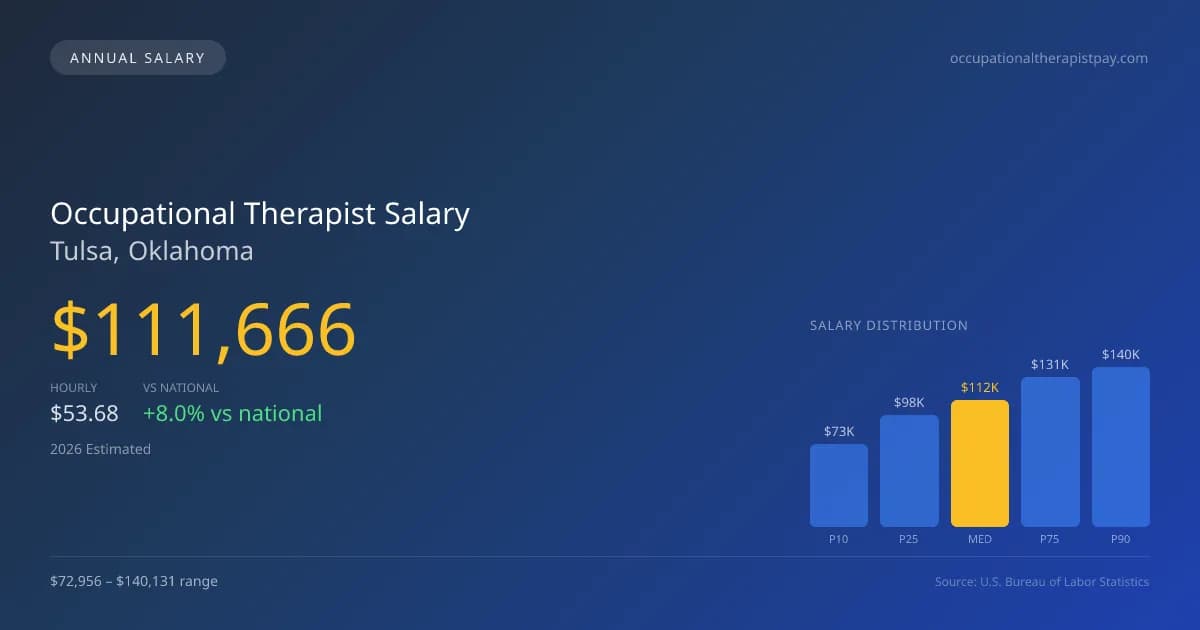
Occupational therapists in Tulsa, Oklahoma can expect a competitive median annual salary of $111,666 in 2026, which is notably higher than the national median of $103,400. This field showcases a wide salary range from $72,956 at the 10th percentile to $140,131 at the 90th percentile, reflecting significant variation based on experience, setting, and specialization. Such figures, derived from 2025 BLS OEWS data, projected to 2026, highlight the premium associated with the Certified Hand Therapist (CHT) credential, often translating to higher compensation in outpatient rehabilitation settings. Tulsa’s robust healthcare sector and the demand for skilled occupational therapists present strong earning potential, making it an appealing location for professionals in the field.
Salary Breakdown
| Percentile | Annual | Hourly |
|---|---|---|
| Entry Level (P10) | $72,956 | $35.07 |
| Lower Range (P25) | $97,763 | $47.01 |
| Median (P50)(typical) | $111,666 | $53.68 |
| Upper Range (P75) | $131,360 | $63.16 |
| Top Earners (P90) | $140,131 | $67.37 |
Median Salary Position
7.99% above the national average
2026 Salary Percentile Distribution in Tulsa
In Tulsa, OK, the occupational therapist salary spread from the 10th to 90th percentile is $67,175 (2026 est.). At $111,666, the local median is 7.99% above the national median of $103,400.
Salary Calculator
At 40 hours/week in Tulsa: You'd be above the median
How Tulsa Occupational Therapist Pay Compares
Tulsa median: $111,666/year (2026)
| Compared To | Median Salary | Tulsa Pays |
|---|---|---|
| Oklahoma Average | $91,906 | +21.50% more |
| National Average | $103,400 | +7.99% more |
Occupational Therapists in Tulsa, OK earn a median of $111,666 per year (2026 est.), which is 7.99% higher than the national median of $103,400 and 21.50% above the Oklahoma state average of $91,906.
Cost-of-Living Adjusted Salary
Tulsa has a cost of living 10.79% below the national average, meaning your salary goes further here.
Adjusted salary = nominal × (100 / CoL index). CoL index: 100 = national average.
Tulsa, OK has a cost-of-living index of 89.214 (below the national average of 100). A occupational therapist earning $111,666 nominally has purchasing power equivalent to $125,166 in an average-cost city — an effective 12.09% boost.
Compare Purchasing Power
Select a city to see how your salary compares after cost of living
Select a city above to compare purchasing power
2019 BLS Actual
$84,140
2025 BLS Actual
$108,350
2026 Current Est.
$111,666
2019–2027 Growth
+36.8%
Salary Trajectory for Occupational Therapists in Tulsa (2019–2027)
2019–2025: actual BLS OEWS data for this metro area. 2026+: CAGR 3.06% projection.
| Year | Annual Salary | Status |
|---|---|---|
| 2019 | $84,140 | Actual |
| 2020 | $90,240 | Actual |
| 2021 | $84,130 | Actual |
| 2022 | $84,760 | Actual |
| 2023 | $100,650 | Actual |
| 2024 | $104,550 | Actual |
| 2025 | $108,350 | Actual |
| 2026(current) | $111,666 | Estimated |
| 2027 | $115,082 | Projected |
Based on 7 years of BLS OEWS data for the Tulsa metropolitan area, the median occupational therapist salary grew 28.8% from $84,140 (2019) to $108,350 (2025). At a 3.06% compound annual growth rate, salaries are projected to reach $115,082 by 2027 — a total increase of $30,942 (36.77%) from 2019.
Note: Historical values (2019–2025) are actual BLS OEWS figures for the Tulsa metropolitan area, sourced from annual Occupational Employment and Wage Statistics surveys. 2026–2026 figures are current estimates, and 2027 values are projections, calculated using a 3.06% CAGR derived from 7-year BLS historical data. Actual salaries may vary based on employer, experience, certifications, and local market conditions.
Salary by Experience Level
| Experience | Estimated Salary Range |
|---|---|
| 0-2 years (New Graduate) | $72,956 – $97,763 |
| 3-5 years (Mid Career) | $97,763 – $111,666 |
| 5+ years (Experienced) | $111,666 – $131,360 |
| 10+ years (Top Earner) | $131,360 – $140,131 |
OT, OTR salary ranges estimated from BLS percentile data. Individual occupational therapist compensation varies by employer, certifications, and specialization.
Occupational Therapist Job Market in Tulsa
In terms of local job dynamics, there are currently around 370 occupational therapists employed in Tulsa. The cost-of-living index, set at 89.214, suggests that professionals in this area enjoy a more favorable purchasing power compared to national averages. The highest pay is often found in skilled nursing facilities and hospital inpatient rehabilitation settings, while outpatient hand therapy clinics also offer competitive wages, particularly for those with CHT certification. Factors driving the salary spread include workplace setting, contractual differences—such as school-year versus year-round schedules—and varying Medicare reimbursement rates that impact pay in skilled nursing facilities and outpatient services. For those looking to maximize their occupational therapist pay in Tulsa, strategic decisions such as pursuing board certifications like CHT and seeking employment in higher-paying sectors can significantly boost earning potential.
More salary data for Tulsa, OK:
Frequently Asked Questions
How much do occupational therapists make in Tulsa, OK in 2026?
Is Tulsa, OK a good place to work as a occupational therapist?
Can occupational therapists make $100K in Tulsa?
What is the cost-of-living adjusted occupational therapist salary in Tulsa?
How much does a occupational therapist make per hour in Tulsa?
Related Pages
Compare Salaries
Career Resources
Nearby Cities in Oklahoma
Written by Jordan Miller, OTR/L
Career Analyst
Jordan has 10 years of experience in occupational therapy. They specialize in pediatrics and work in a rehabilitation clinic.
Methodology & Data Source
Salary figures on this page are 2026 projections based on the Bureau of Labor Statistics Occupational Employment and Wage Statistics (OEWS) survey, May 2026 release. The BLS reported a median annual salary of $108,350 for occupational therapistsin the Tulsa metropolitan area. A 3.06% compound annual growth rate (CAGR), calculated from 6-year national BLS wage trends, was applied to project current 2026 compensation. Percentile ranges (P10–P90) represent the full salary distribution across experience levels and practice settings in this market.
Data Sources & Methodology
Source: BLS, OEWS, 7-year dataset (–). Per-city data from annual BLS metropolitan area surveys.
2026 figures are projected from 2025 BLS data using a compound annual growth rate (CAGR) of 3.06%, derived from historical BLS wage trends for occupational therapists (SOC 29-1122).
Compiled and verified by Jordan Miller, OTR/L, a licensed occupational therapist with 10+ years of clinical experience. · View source data at BLS.gov