Occupational Therapist Salary in Bend, OR: $118,385 (2026)
Quick Answer:A full-time occupational therapist in Bend, OR earns a median $118,385/year (≈ $56.92/hour) in nominal terms for 2026 — projected from BLS OEWS 2025 (SOC 29-1122). Once you factor in Bend's price level (4% above national, BEA RPP 103.6), that paycheck buys what $114,264 would nationally. Nominal pay sits 4.7% above the Oregon state average.
Official BLS data · View source
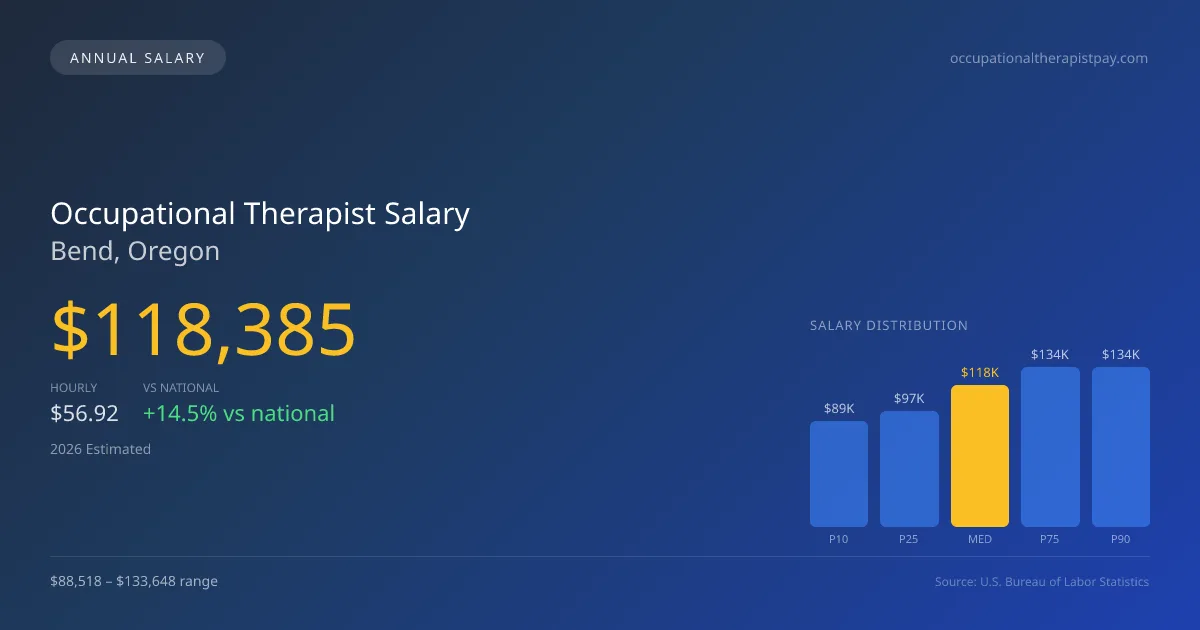
Occupational therapists in Bend, Oregon are projected to earn a median annual salary of $118,385 in 2026, which reflects a notable increase compared to national standards. This figure shows a 14.49% premium over the national median of $103,400. The anticipated salary range for the position spans from $88,518 at the 10th percentile to $133,648 at the 90th percentile, indicating that there is considerable potential for higher earnings based on experience, certifications, and work settings. These salary projections are derived from the latest data based on 2025 BLS OEWS surveys. With specialized credentials like the Certified Hand Therapist (CHT) certification rewarding practitioners significantly, there’s a strong incentive for OTs in Bend to pursue further education and accreditation, enhancing their earning potential in a competitive job market.
Salary Breakdown
| Percentile | Annual | Hourly |
|---|---|---|
| Entry Level (P10) | $88,518 | $42.56 |
| Lower Range (P25) | $96,969 | $46.62 |
| Median (P50)(typical) | $118,385 | $56.92 |
| Upper Range (P75) | $133,648 | $64.26 |
| Top Earners (P90) | $133,648 | $64.26 |
Median Salary Position
14.49% above the national average
2026 Salary Percentile Distribution in Bend
In Bend, OR, the occupational therapist salary spread from the 10th to 90th percentile is $45,130 (2026 est.). At $118,385, the local median is 14.49% above the national median of $103,400.
Salary Calculator
At 40 hours/week in Bend: You'd be above the median
How Bend Occupational Therapist Pay Compares
Bend median: $118,385/year (2026)
| Compared To | Median Salary | Bend Pays |
|---|---|---|
| Oregon Average | $113,071 | +4.70% more |
| National Average | $103,400 | +14.49% more |
Occupational Therapists in Bend, OR earn a median of $118,385 per year (2026 est.), which is 14.49% higher than the national median of $103,400 and 4.70% above the Oregon state average of $113,071.
Cost-of-Living Adjusted Salary
Bend has a cost of living 3.61% above the national average.
Adjusted salary = nominal × (100 / CoL index). CoL index: 100 = national average.
Bend, OR has a cost-of-living index of 103.607 (above the national average of 100). While the nominal salary of $118,385 is competitive, the higher cost of living reduces purchasing power to an effective $114,264 — a 3.48% reduction.
Compare Purchasing Power
Select a city to see how your salary compares after cost of living
Select a city above to compare purchasing power
2019 BLS Actual
$91,030
2025 BLS Actual
$114,870
2026 Current Est.
$118,385
2019–2027 Growth
+34.0%
Salary Trajectory for Occupational Therapists in Bend (2019–2027)
2019–2025: actual BLS OEWS data for this metro area. 2026+: CAGR 3.06% projection.
| Year | Annual Salary | Status |
|---|---|---|
| 2019 | $91,030 | Actual |
| 2020 | $98,784 | Actual |
| 2021 | $96,770 | Actual |
| 2022 | $108,230 | Actual |
| 2023 | $103,930 | Actual |
| 2024 | $108,110 | Actual |
| 2025 | $114,870 | Actual |
| 2026(current) | $118,385 | Estimated |
| 2027 | $122,008 | Projected |
Based on 7 years of BLS OEWS data for the Bend metropolitan area, the median occupational therapist salary grew 26.2% from $91,030 (2019) to $114,870 (2025). At a 3.06% compound annual growth rate, salaries are projected to reach $122,008 by 2027 — a total increase of $30,978 (34.03%) from 2019.
Note: Historical values (2019–2025) are actual BLS OEWS figures for the Bend metropolitan area, sourced from annual Occupational Employment and Wage Statistics surveys. 2026–2026 figures are current estimates, and 2027 values are projections, calculated using a 3.06% CAGR derived from 7-year BLS historical data. Actual salaries may vary based on employer, experience, certifications, and local market conditions.
Salary by Experience Level
| Experience | Estimated Salary Range |
|---|---|
| 0-2 years (New Graduate) | $88,518 – $96,969 |
| 3-5 years (Mid Career) | $96,969 – $118,385 |
| 5+ years (Experienced) | $118,385 – $133,648 |
| 10+ years (Top Earner) | $133,648 – $133,648 |
OT, OTR salary ranges estimated from BLS percentile data. Individual occupational therapist compensation varies by employer, certifications, and specialization.
Occupational Therapist Job Market in Bend
The local job market for occupational therapists is robust, with 100 professionals actively employed in Bend. However, the cost of living poses challenges, with a cost of living index of 103.607, indicating higher-than-average expenses that can affect take-home pay. Agencies such as hospital inpatient rehab and outpatient hand therapy clinics typically offer the most competitive salaries, while school district contracts may provide lower compensation due to seasonal contracts. Factors such as the type of employer, productivity expectations, and the potential impact of Medicare cuts on skilled nursing facilities and outpatient services contribute to the variance in salary. For those looking to maximize their occupational therapist pay in Bend, obtaining specialized certifications, considering roles in higher-paying settings, and understanding the nuances of local employment contracts can significantly enhance their overall compensation strategy in this growing field.
More salary data for Bend, OR:
Frequently Asked Questions
How much do occupational therapists make in Bend, OR in 2026?
Is Bend, OR a good place to work as a occupational therapist?
Can occupational therapists make $100K in Bend?
What is the cost-of-living adjusted occupational therapist salary in Bend?
How much does a occupational therapist make per hour in Bend?
Related Pages
Compare Salaries
Career Resources
Nearby Cities in Oregon
Written by Jordan Miller, OTR/L
Career Analyst
Jordan has 10 years of experience in occupational therapy. They specialize in pediatrics and work in a rehabilitation clinic.
Methodology & Data Source
Salary figures on this page are 2026 projections based on the Bureau of Labor Statistics Occupational Employment and Wage Statistics (OEWS) survey, May 2026 release. The BLS reported a median annual salary of $114,870 for occupational therapistsin the Bend metropolitan area. A 3.06% compound annual growth rate (CAGR), calculated from 6-year national BLS wage trends, was applied to project current 2026 compensation. Percentile ranges (P10–P90) represent the full salary distribution across experience levels and practice settings in this market.
Data Sources & Methodology
Source: BLS, OEWS, 6-year dataset (–). Per-city data from annual BLS metropolitan area surveys.
2026 figures are projected from 2025 BLS data using a compound annual growth rate (CAGR) of 3.06%, derived from historical BLS wage trends for occupational therapists (SOC 29-1122).
Compiled and verified by Jordan Miller, OTR/L, a licensed occupational therapist with 10+ years of clinical experience. · View source data at BLS.gov