Occupational Therapist Salary in Forest Grove, OR: $110,380 (2026)
Quick Answer:A full-time occupational therapist in Forest Grove, OR earns a median $110,380/year (≈ $53.07/hour) in nominal terms for 2026 — projected from BLS OEWS 2025 (SOC 29-1122). Once you factor in Forest Grove's price level (3% above national, BEA RPP 102.6), that paycheck buys what $107,583 would nationally. Nominal pay sits 2.4% below the Oregon state average.
Based on BLS state-level estimates · View source
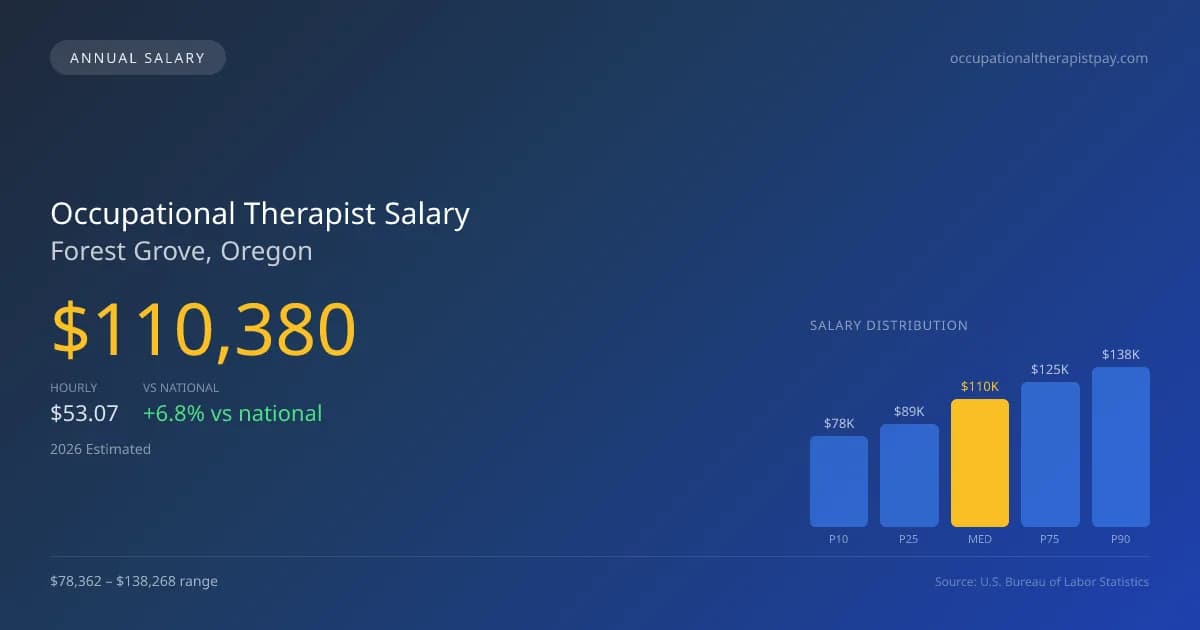
In Forest Grove, Oregon, the projected occupational therapist salary for 2026 stands at $110,380, reflecting a competitive edge over the national median salary of $103,400. The local salary spectrum ranges from a lower tenth percentile at $78,362 to an upper ninetieth percentile reaching $138,268. These figures, derived from 2025 BLS data and adjusted for the cost of living, highlight the advantageous compensation for therapists in various settings. In this city, practitioners can choose between year-round positions in hospital rehabilitative services, school-year contracts, or skilled nursing facilities, directly influencing their earning potential and work-life balance.
About the Forest Grove Market
Salary estimated from Oregon average ($96,000) adjusted for local cost of living.
Salary Breakdown
| Percentile | Annual | Hourly |
|---|---|---|
| Entry Level (P10) | $78,362 | $37.68 |
| Lower Range (P25) | $89,150 | $42.86 |
| Median (P50)(typical) | $110,380 | $53.07 |
| Upper Range (P75) | $125,348 | $60.26 |
| Top Earners (P90) | $138,268 | $66.47 |
Median Salary Position
6.75% above the national average
2026 Salary Percentile Distribution in Forest Grove
In Forest Grove, OR, the occupational therapist salary spread from the 10th to 90th percentile is $59,906 (2026 est.). At $110,380, the local median is 6.75% above the national median of $103,400.
Salary Calculator
At 40 hours/week in Forest Grove: You'd be above the median
How Forest Grove Occupational Therapist Pay Compares
Forest Grove median: $110,380/year (2026)
| Compared To | Median Salary | Forest Grove Pays |
|---|---|---|
| Oregon Average | $113,095 | -2.40% less |
| National Average | $103,400 | +6.75% more |
Occupational Therapists in Forest Grove, OR earn a median of $110,380 per year (2026 est.), which is 6.75% higher than the national median of $103,400 and 2.40% below the Oregon state average of $113,095.
Cost-of-Living Adjusted Salary
Forest Grove has a cost of living 2.60% above the national average.
Adjusted salary = nominal × (100 / CoL index). CoL index: 100 = national average.
Forest Grove, OR has a cost-of-living index of 102.6 (above the national average of 100). While the nominal salary of $110,380 is competitive, the higher cost of living reduces purchasing power to an effective $107,583 — a 2.53% reduction.
Compare Purchasing Power
Select a city to see how your salary compares after cost of living
Select a city above to compare purchasing power
2019 BLS Actual
$90,685
2025 BLS Actual
$107,103
2026 Current Est.
$110,380
2019–2027 Growth
+25.4%
Salary Trajectory for Occupational Therapists in Forest Grove (2019–2027)
2019–2025: actual BLS OEWS data for this metro area. 2026+: CAGR 3.06% projection.
| Year | Annual Salary | Status |
|---|---|---|
| 2019 | $90,685 | Actual |
| 2020 | $92,105 | Actual |
| 2021 | $91,347 | Actual |
| 2022 | $99,470 | Actual |
| 2023 | $102,876 | Actual |
| 2024 | $96,164 | Actual |
| 2025 | $107,103 | Actual |
| 2026(current) | $110,380 | Estimated |
| 2027 | $113,758 | Projected |
Based on 7 years of BLS OEWS data for the Forest Grove metropolitan area, the median occupational therapist salary grew 18.1% from $90,685 (2019) to $107,103 (2025). At a 3.06% compound annual growth rate, salaries are projected to reach $113,758 by 2027 — a total increase of $23,073 (25.44%) from 2019.
Note: Historical values (2019–2025) are actual BLS OEWS figures for the Forest Grove metropolitan area, sourced from annual Occupational Employment and Wage Statistics surveys. 2026–2026 figures are current estimates, and 2027 values are projections, calculated using a 3.06% CAGR derived from 7-year BLS historical data. Actual salaries may vary based on employer, experience, certifications, and local market conditions.
Salary by Experience Level
| Experience | Estimated Salary Range |
|---|---|
| 0-2 years (New Graduate) | $78,362 – $89,150 |
| 3-5 years (Mid Career) | $89,150 – $110,380 |
| 5+ years (Experienced) | $110,380 – $125,348 |
| 10+ years (Top Earner) | $125,348 – $138,268 |
OT, OTR salary ranges estimated from BLS percentile data. Individual occupational therapist compensation varies by employer, certifications, and specialization.
Occupational Therapist Job Market in Forest Grove
The job market for occupational therapists in Forest Grove remains relatively stable, with four practitioners currently employed. This sector's viability is influenced by the area's cost of living index at 102.6, suggesting that salaries here provide just a slight edge over the national average but may not stretch as far in purchasing power. Local employers, such as skilled nursing facilities and hospital inpatient rehabilitation programs, often offer the most lucrative positions. Productivity expectations, the presence of advanced certifications such as the CHT specialty, and the nature of school versus hospital contracts can significantly affect wage variation. To maximize compensation, occupational therapists in this market should consider pursuing specialty certifications and exploring roles in high-paying facilities, which tend to offer better reimbursement structures, thus fostering greater overall income potential in this specific region.
More salary data for Forest Grove, OR:
Frequently Asked Questions
How much do occupational therapists make in Forest Grove, OR in 2026?
Is Forest Grove, OR a good place to work as a occupational therapist?
Can occupational therapists make $100K in Forest Grove?
What is the cost-of-living adjusted occupational therapist salary in Forest Grove?
How much does a occupational therapist make per hour in Forest Grove?
Related Pages
Compare Salaries
Career Resources
Nearby Cities in Oregon
Written by Jordan Miller, OTR/L
Career Analyst
Jordan has 10 years of experience in occupational therapy. They specialize in pediatrics and work in a rehabilitation clinic.
Methodology & Data Source
Salary figures on this page are 2026 projections based on the Bureau of Labor Statistics Occupational Employment and Wage Statistics (OEWS) survey, May 2026 release. The BLS reported a median annual salary of $107,103 for occupational therapistsin the Forest Grove metropolitan area. A 3.06% compound annual growth rate (CAGR), calculated from 6-year national BLS wage trends, was applied to project current 2026 compensation. Percentile ranges (P10–P90) represent the full salary distribution across experience levels and practice settings in this market.
Data Sources & Methodology
Salary data for Forest Grove is estimated from official BLS state-level occupational wage data (2025), adjusted for regional cost-of-living differences using BEA RPP (Regional Price Parities).
2026 figures are projected from 2025 BLS data using a compound annual growth rate (CAGR) of 3.06%, derived from historical BLS wage trends for occupational therapists (SOC 29-1122).
Compiled and verified by Jordan Miller, OTR/L, a licensed occupational therapist with 10+ years of clinical experience. · View source data at BLS.gov