Occupational Therapist Salary in Redmond, OR: $109,881 (2026)
Quick Answer:A full-time occupational therapist in Redmond, OR earns a median $109,881/year (≈ $52.83/hour) in nominal terms for 2026 — projected from BLS OEWS 2025 (SOC 29-1122). Once you factor in Redmond's price level (3% above national, BEA RPP 102.6), that paycheck buys what $107,096 would nationally. Nominal pay sits 2.8% below the Oregon state average.
Based on BLS state-level estimates · View source
Occupational therapists in Redmond, Oregon, are projected to earn a median annual salary of $109,881 in 2026, which represents a notable increase compared to national trends. With salaries ranging from $77,180 at the 10th percentile to $136,671 at the 90th percentile, this reflects a competitive market for OTs in this area. These figures are derived from estimates based on 2025 BLS Occupational Employment Statistics data, adjusted for regional price levels. The local job market for occupational therapists shows resilience, especially in light of the adverse effects of Medicare cuts on skilled nursing facility (SNF) and outpatient therapy compensation post-2022, affecting the overall pay landscape for occupational therapists in Redmond.
About the Redmond Market
Salary estimated from Oregon average ($96,000) adjusted for local cost of living.
Salary Breakdown
| Percentile | Annual | Hourly |
|---|---|---|
| Entry Level (P10) | $77,180 | $37.10 |
| Lower Range (P25) | $94,831 | $45.59 |
| Median (P50)(typical) | $109,881 | $52.83 |
| Upper Range (P75) | $124,187 | $59.70 |
| Top Earners (P90) | $136,671 | $65.71 |
Median Salary Position
6.27% above the national average
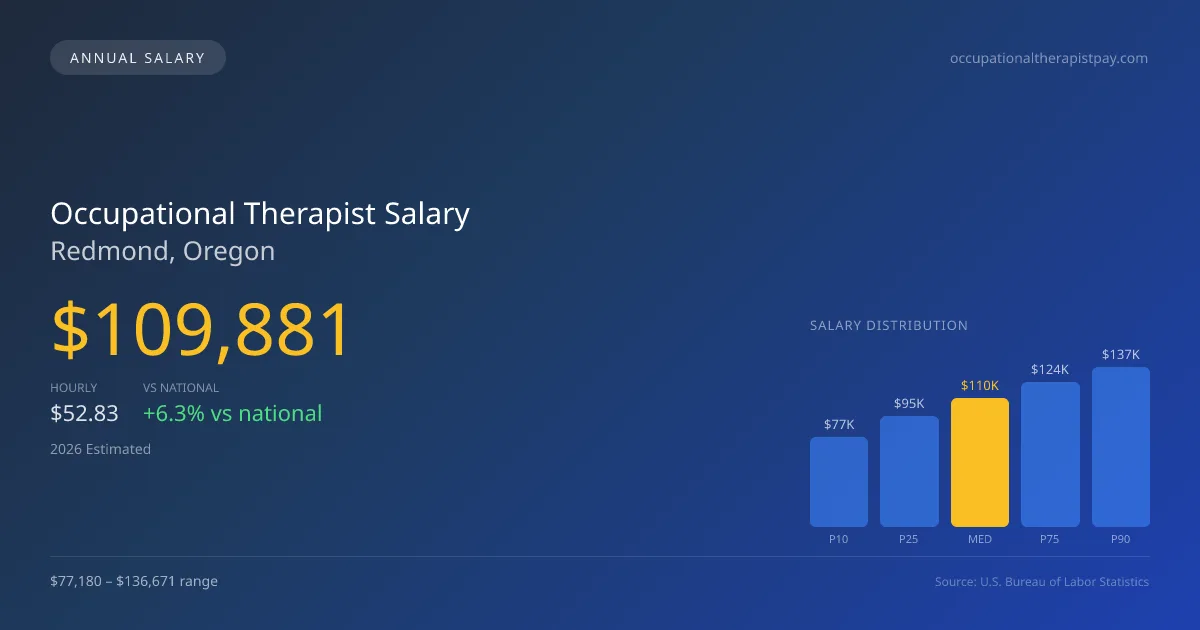
2026 Salary Percentile Distribution in Redmond
In Redmond, OR, the occupational therapist salary spread from the 10th to 90th percentile is $59,491 (2026 est.). At $109,881, the local median is 6.27% above the national median of $103,400.
Salary Calculator
At 40 hours/week in Redmond: You'd be above the median
How Redmond Occupational Therapist Pay Compares
Redmond median: $109,881/year (2026)
| Compared To | Median Salary | Redmond Pays |
|---|---|---|
| Oregon Average | $113,046 | -2.80% less |
| National Average | $103,400 | +6.27% more |
Occupational Therapists in Redmond, OR earn a median of $109,881 per year (2026 est.), which is 6.27% higher than the national median of $103,400 and 2.80% below the Oregon state average of $113,046.
Cost-of-Living Adjusted Salary
Redmond has a cost of living 2.60% above the national average.
Adjusted salary = nominal × (100 / CoL index). CoL index: 100 = national average.
Redmond, OR has a cost-of-living index of 102.6 (above the national average of 100). While the nominal salary of $109,881 is competitive, the higher cost of living reduces purchasing power to an effective $107,096 — a 2.53% reduction.
Compare Purchasing Power
Select a city to see how your salary compares after cost of living
Select a city above to compare purchasing power
2019 BLS Actual
$90,274
2025 BLS Actual
$106,618
2026 Current Est.
$109,881
2019–2027 Growth
+25.4%
Salary Trajectory for Occupational Therapists in Redmond (2019–2027)
2019–2025: actual BLS OEWS data for this metro area. 2026+: CAGR 3.06% projection.
| Year | Annual Salary | Status |
|---|---|---|
| 2019 | $90,274 | Actual |
| 2020 | $91,687 | Actual |
| 2021 | $90,933 | Actual |
| 2022 | $99,020 | Actual |
| 2023 | $102,410 | Actual |
| 2024 | $95,728 | Actual |
| 2025 | $106,618 | Actual |
| 2026(current) | $109,881 | Estimated |
| 2027 | $113,243 | Projected |
Based on 7 years of BLS OEWS data for the Redmond metropolitan area, the median occupational therapist salary grew 18.1% from $90,274 (2019) to $106,618 (2025). At a 3.06% compound annual growth rate, salaries are projected to reach $113,243 by 2027 — a total increase of $22,969 (25.44%) from 2019.
Note: Historical values (2019–2025) are actual BLS OEWS figures for the Redmond metropolitan area, sourced from annual Occupational Employment and Wage Statistics surveys. 2026–2026 figures are current estimates, and 2027 values are projections, calculated using a 3.06% CAGR derived from 7-year BLS historical data. Actual salaries may vary based on employer, experience, certifications, and local market conditions.
Salary by Experience Level
| Experience | Estimated Salary Range |
|---|---|
| 0-2 years (New Graduate) | $77,180 – $94,831 |
| 3-5 years (Mid Career) | $94,831 – $109,881 |
| 5+ years (Experienced) | $109,881 – $124,187 |
| 10+ years (Top Earner) | $124,187 – $136,671 |
OT, OTR salary ranges estimated from BLS percentile data. Individual occupational therapist compensation varies by employer, certifications, and specialization.
Occupational Therapist Job Market in Redmond
In terms of the local job market, there are currently five occupational therapists employed in Redmond, and with a cost-of-living index of 102.6, the purchasing power may be somewhat limited despite the favorable salary projections. Employers in the area that tend to offer higher pay include hospital inpatient rehabilitation facilities and outpatient settings, often due to greater productivity expectations and specialized services like Certified Hand Therapy (CHT). This wider pay range can be influenced by various factors such as contract types, with year-round positions generally commanding higher salaries than school-year contracts. OTs seeking to maximize their earnings in Redmond should consider pursuing board certifications, such as CHT, to increase their marketability, while also evaluating opportunities in more lucrative healthcare settings such as mental health facilities or home health agencies.
More salary data for Redmond, OR:
Frequently Asked Questions
How much do occupational therapists make in Redmond, OR in 2026?
Is Redmond, OR a good place to work as a occupational therapist?
Can occupational therapists make $100K in Redmond?
What is the cost-of-living adjusted occupational therapist salary in Redmond?
How much does a occupational therapist make per hour in Redmond?
Related Pages
Compare Salaries
Career Resources
Nearby Cities in Oregon
Written by Jordan Miller, OTR/L
Career Analyst
Jordan has 10 years of experience in occupational therapy. They specialize in pediatrics and work in a rehabilitation clinic.
Methodology & Data Source
Salary figures on this page are 2026 projections based on the Bureau of Labor Statistics Occupational Employment and Wage Statistics (OEWS) survey, May 2026 release. The BLS reported a median annual salary of $106,618 for occupational therapistsin the Redmond metropolitan area. A 3.06% compound annual growth rate (CAGR), calculated from 6-year national BLS wage trends, was applied to project current 2026 compensation. Percentile ranges (P10–P90) represent the full salary distribution across experience levels and practice settings in this market.
Data Sources & Methodology
Salary data for Redmond is estimated from official BLS state-level occupational wage data (2025), adjusted for regional cost-of-living differences using BEA RPP (Regional Price Parities).
2026 figures are projected from 2025 BLS data using a compound annual growth rate (CAGR) of 3.06%, derived from historical BLS wage trends for occupational therapists (SOC 29-1122).
Compiled and verified by Jordan Miller, OTR/L, a licensed occupational therapist with 10+ years of clinical experience. · View source data at BLS.gov