Occupational Therapist Salary in Roanoke, VA: $101,009 (2026)
Quick Answer:A full-time occupational therapist in Roanoke, VA earns a median $101,009/year (≈ $48.56/hour) in nominal terms for 2026 — projected from BLS OEWS 2025 (SOC 29-1122). Once you factor in Roanoke's price level (6% below national, BEA RPP 93.6), that paycheck buys what $107,895 would nationally. Nominal pay sits 1.4% below the Virginia state average.
Official BLS data · View source
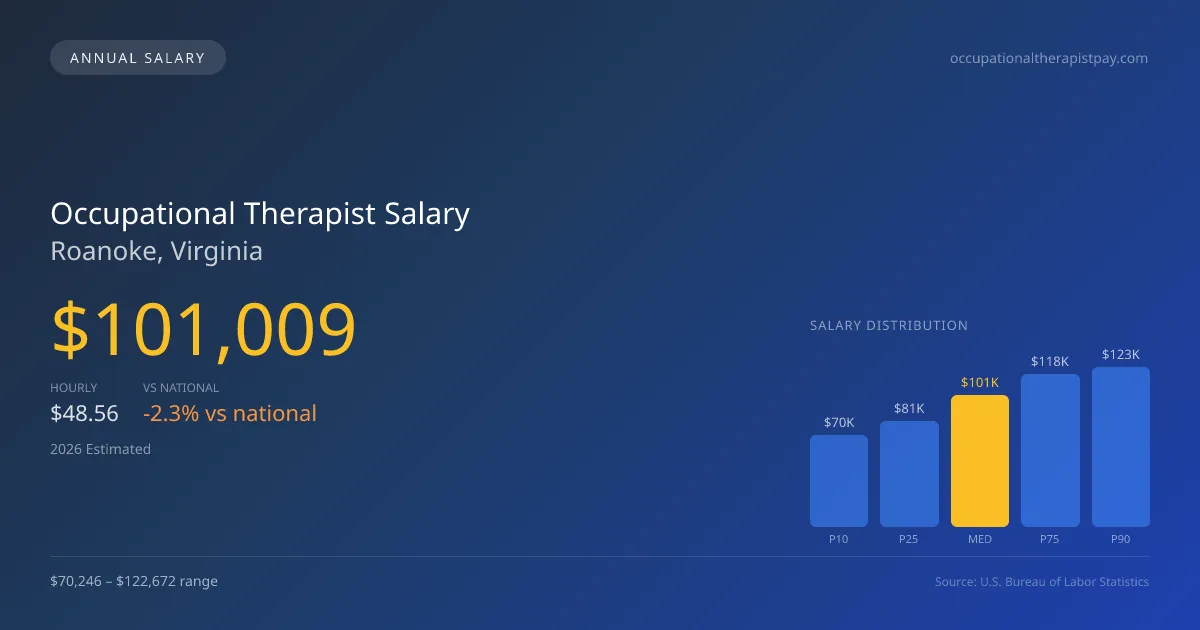
In 2026, the median annual occupational therapist salary in Roanoke, Virginia, is projected to be $101,009, reflecting a slight decrease compared to the national median of $103,400. This projection comes on the heels of Medicare payment cuts impacting skilled nursing facilities and outpatient therapy programs post-2022, which could influence compensation across various settings locally. The salary range for occupational therapists in Roanoke is from $70,246 at the 10th percentile to $122,672 at the 90th percentile, based on official Bureau of Labor Statistics (BLS) OEWS data. As the job market continues to evolve amidst these challenges, the demand for occupational therapists in the region remains robust, with 180 professionals currently employed and poised for a 3.06% growth rate annually over the next five years.
Salary Breakdown
| Percentile | Annual | Hourly |
|---|---|---|
| Entry Level (P10) | $70,246 | $33.77 |
| Lower Range (P25) | $81,119 | $39.00 |
| Median (P50)(typical) | $101,009 | $48.56 |
| Upper Range (P75) | $117,581 | $56.53 |
| Top Earners (P90) | $122,672 | $58.97 |
Median Salary Position
2.31% below the national average
2026 Salary Percentile Distribution in Roanoke
In Roanoke, VA, the occupational therapist salary spread from the 10th to 90th percentile is $52,426 (2026 est.). At $101,009, the local median is 2.31% below the national median of $103,400.
Salary Calculator
At 40 hours/week in Roanoke: You'd be above the median
How Roanoke Occupational Therapist Pay Compares
Roanoke median: $101,009/year (2026)
| Compared To | Median Salary | Roanoke Pays |
|---|---|---|
| Virginia Average | $102,443 | -1.40% less |
| National Average | $103,400 | -2.31% less |
Occupational Therapists in Roanoke, VA earn a median of $101,009 per year (2026 est.), which is 2.31% lower than the national median of $103,400 and 1.40% below the Virginia state average of $102,443.
Cost-of-Living Adjusted Salary
Roanoke has a cost of living 6.38% below the national average, meaning your salary goes further here.
Adjusted salary = nominal × (100 / CoL index). CoL index: 100 = national average.
Roanoke, VA has a cost-of-living index of 93.618 (below the national average of 100). A occupational therapist earning $101,009 nominally has purchasing power equivalent to $107,895 in an average-cost city — an effective 6.82% boost.
Compare Purchasing Power
Select a city to see how your salary compares after cost of living
Select a city above to compare purchasing power
2019 BLS Actual
$85,480
2025 BLS Actual
$98,010
2026 Current Est.
$101,009
2019–2027 Growth
+21.8%
Salary Trajectory for Occupational Therapists in Roanoke (2019–2027)
2019–2025: actual BLS OEWS data for this metro area. 2026+: CAGR 3.06% projection.
| Year | Annual Salary | Status |
|---|---|---|
| 2019 | $85,480 | Actual |
| 2020 | $91,960 | Actual |
| 2021 | $95,620 | Actual |
| 2022 | $92,660 | Actual |
| 2023 | $92,850 | Actual |
| 2024 | $96,530 | Actual |
| 2025 | $98,010 | Actual |
| 2026(current) | $101,009 | Estimated |
| 2027 | $104,100 | Projected |
Based on 7 years of BLS OEWS data for the Roanoke metropolitan area, the median occupational therapist salary grew 14.7% from $85,480 (2019) to $98,010 (2025). At a 3.06% compound annual growth rate, salaries are projected to reach $104,100 by 2027 — a total increase of $18,620 (21.78%) from 2019.
Note: Historical values (2019–2025) are actual BLS OEWS figures for the Roanoke metropolitan area, sourced from annual Occupational Employment and Wage Statistics surveys. 2026–2026 figures are current estimates, and 2027 values are projections, calculated using a 3.06% CAGR derived from 7-year BLS historical data. Actual salaries may vary based on employer, experience, certifications, and local market conditions.
Salary by Experience Level
| Experience | Estimated Salary Range |
|---|---|
| 0-2 years (New Graduate) | $70,246 – $81,119 |
| 3-5 years (Mid Career) | $81,119 – $101,009 |
| 5+ years (Experienced) | $101,009 – $117,581 |
| 10+ years (Top Earner) | $117,581 – $122,672 |
OT, OTR salary ranges estimated from BLS percentile data. Individual occupational therapist compensation varies by employer, certifications, and specialization.
Occupational Therapist Job Market in Roanoke
The job market for occupational therapists in Roanoke is anchored by a relatively small but stable group of 180 practitioners, which may influence pay scales and job availability. With a cost-of-living index of 93.618, residents benefit from a lower-than-average living expense, translating to enhanced purchasing power for their salaries. Among various roles, skilled nursing facilities and hospital inpatient rehabilitation provide some of the most competitive compensation packages, surpassing those offered by school districts and early intervention programs. The disparity in salaries is driven by factors such as the prestige of inpatient hospital work, potential stipends for board-certified hand therapy specialists, and productivity requirements tied to contract types. For those aiming to maximize their occupational therapist pay in Roanoke, pursuing certifications like the CHT and targeting positions in high-paying settings could provide significant financial benefits.
More salary data for Roanoke, VA:
Frequently Asked Questions
How much do occupational therapists make in Roanoke, VA in 2026?
Is Roanoke, VA a good place to work as a occupational therapist?
Can occupational therapists make $100K in Roanoke?
What is the cost-of-living adjusted occupational therapist salary in Roanoke?
How much does a occupational therapist make per hour in Roanoke?
Related Pages
Compare Salaries
Career Resources
Nearby Cities in Virginia
Written by Jordan Miller, OTR/L
Career Analyst
Jordan has 10 years of experience in occupational therapy. They specialize in pediatrics and work in a rehabilitation clinic.
Methodology & Data Source
Salary figures on this page are 2026 projections based on the Bureau of Labor Statistics Occupational Employment and Wage Statistics (OEWS) survey, May 2026 release. The BLS reported a median annual salary of $98,010 for occupational therapistsin the Roanoke metropolitan area. A 3.06% compound annual growth rate (CAGR), calculated from 6-year national BLS wage trends, was applied to project current 2026 compensation. Percentile ranges (P10–P90) represent the full salary distribution across experience levels and practice settings in this market.
Data Sources & Methodology
Source: BLS, OEWS, 7-year dataset (–). Per-city data from annual BLS metropolitan area surveys.
2026 figures are projected from 2025 BLS data using a compound annual growth rate (CAGR) of 3.06%, derived from historical BLS wage trends for occupational therapists (SOC 29-1122).
Compiled and verified by Jordan Miller, OTR/L, a licensed occupational therapist with 10+ years of clinical experience. · View source data at BLS.gov