Occupational Therapist Salary in Tumwater, WA: $109,683 (2026)
Quick Answer:A full-time occupational therapist in Tumwater, WA earns a median $109,683/year (≈ $52.74/hour) in nominal terms for 2026 — projected from BLS OEWS 2025 (SOC 29-1122). Once you factor in Tumwater's price level (7% above national, BEA RPP 107.4), that paycheck buys what $102,126 would nationally. Nominal pay sits 1.3% above the Washington state average.
Based on BLS state-level estimates · View source
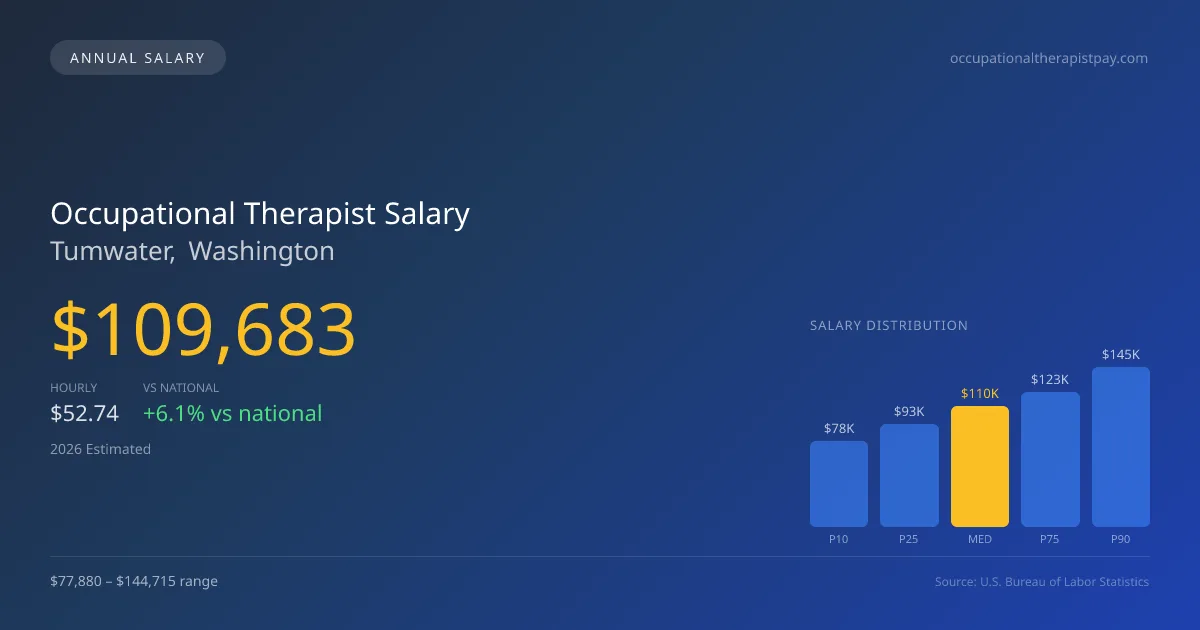
In 2026, the occupational therapist salary in Tumwater is projected to reach a median of $109,683, which exceeds the national median of $103,400 by 6.08%. Salaries in the area range broadly from $77,880 at the 10th percentile to $144,715 at the 90th percentile, reflecting various employment settings. The strong median pay indicates robust opportunities for occupational therapists, especially considering local estimates are adjusted for regional costs. Potential job opportunities can be found in different environments such as hospitals, skilled nursing facilities, and schools, which each present their own salary structures and contract arrangements that can influence annual income.
About the Tumwater Market
Salary estimated from Washington average ($98,000) adjusted for local cost of living.
Salary Breakdown
| Percentile | Annual | Hourly |
|---|---|---|
| Entry Level (P10) | $77,880 | $37.44 |
| Lower Range (P25) | $93,184 | $44.80 |
| Median (P50)(typical) | $109,683 | $52.74 |
| Upper Range (P75) | $122,533 | $58.91 |
| Top Earners (P90) | $144,715 | $69.58 |
Median Salary Position
6.08% above the national average
2026 Salary Percentile Distribution in Tumwater
In Tumwater, WA, the occupational therapist salary spread from the 10th to 90th percentile is $66,835 (2026 est.). At $109,683, the local median is 6.08% above the national median of $103,400.
Salary Calculator
At 40 hours/week in Tumwater: You'd be in the lower-middle range
How Tumwater Occupational Therapist Pay Compares
Tumwater median: $109,683/year (2026)
| Compared To | Median Salary | Tumwater Pays |
|---|---|---|
| Washington Average | $108,275 | +1.30% more |
| National Average | $103,400 | +6.08% more |
Occupational Therapists in Tumwater, WA earn a median of $109,683 per year (2026 est.), which is 6.08% higher than the national median of $103,400 and 1.30% above the Washington state average of $108,275.
Cost-of-Living Adjusted Salary
Tumwater has a cost of living 7.40% above the national average.
Adjusted salary = nominal × (100 / CoL index). CoL index: 100 = national average.
Tumwater, WA has a cost-of-living index of 107.4 (above the national average of 100). While the nominal salary of $109,683 is competitive, the higher cost of living reduces purchasing power to an effective $102,126 — a 6.89% reduction.
Compare Purchasing Power
Select a city to see how your salary compares after cost of living
Select a city above to compare purchasing power
2019 BLS Actual
$90,112
2025 BLS Actual
$106,426
2026 Current Est.
$109,683
2019–2027 Growth
+25.4%
Salary Trajectory for Occupational Therapists in Tumwater (2019–2027)
2019–2025: actual BLS OEWS data for this metro area. 2026+: CAGR 3.06% projection.
| Year | Annual Salary | Status |
|---|---|---|
| 2019 | $90,112 | Actual |
| 2020 | $91,522 | Actual |
| 2021 | $90,769 | Actual |
| 2022 | $98,842 | Actual |
| 2023 | $102,225 | Actual |
| 2024 | $103,030 | Actual |
| 2025 | $106,426 | Actual |
| 2026(current) | $109,683 | Estimated |
| 2027 | $113,039 | Projected |
Based on 7 years of BLS OEWS data for the Tumwater metropolitan area, the median occupational therapist salary grew 18.1% from $90,112 (2019) to $106,426 (2025). At a 3.06% compound annual growth rate, salaries are projected to reach $113,039 by 2027 — a total increase of $22,927 (25.44%) from 2019.
Note: Historical values (2019–2025) are actual BLS OEWS figures for the Tumwater metropolitan area, sourced from annual Occupational Employment and Wage Statistics surveys. 2026–2026 figures are current estimates, and 2027 values are projections, calculated using a 3.06% CAGR derived from 7-year BLS historical data. Actual salaries may vary based on employer, experience, certifications, and local market conditions.
Salary by Experience Level
| Experience | Estimated Salary Range |
|---|---|
| 0-2 years (New Graduate) | $77,880 – $93,184 |
| 3-5 years (Mid Career) | $93,184 – $109,683 |
| 5+ years (Experienced) | $109,683 – $122,533 |
| 10+ years (Top Earner) | $122,533 – $144,715 |
OT, OTR salary ranges estimated from BLS percentile data. Individual occupational therapist compensation varies by employer, certifications, and specialization.
Occupational Therapist Job Market in Tumwater
The job market for occupational therapists in Tumwater has a stable base with only six professionals employed in the area, signaling a focused but competitive landscape. With a cost of living index of 107.4, the purchasing power for local therapists may feel tighter than in other regions, highlighting the importance of choosing optimal employment settings. Typically, skilled nursing facilities and hospitals offer the highest pay, often encouraged by higher productivity expectations and Medicare reimbursement rates. Therapists looking to maximize their occupational therapist pay in Tumwater, WA, should consider obtaining specialized certifications like the CHT for hand therapy, which commands a premium, and seek year-round contracts that can provide consistent income, as school-year positions typically yield less financial stability.
More salary data for Tumwater, WA:
Frequently Asked Questions
How much do occupational therapists make in Tumwater, WA in 2026?
Is Tumwater, WA a good place to work as a occupational therapist?
Can occupational therapists make $100K in Tumwater?
What is the cost-of-living adjusted occupational therapist salary in Tumwater?
How much does a occupational therapist make per hour in Tumwater?
Related Pages
Compare Salaries
Career Resources
Nearby Cities in Washington
Written by Jordan Miller, OTR/L
Career Analyst
Jordan has 10 years of experience in occupational therapy. They specialize in pediatrics and work in a rehabilitation clinic.
Methodology & Data Source
Salary figures on this page are 2026 projections based on the Bureau of Labor Statistics Occupational Employment and Wage Statistics (OEWS) survey, May 2026 release. The BLS reported a median annual salary of $106,426 for occupational therapistsin the Tumwater metropolitan area. A 3.06% compound annual growth rate (CAGR), calculated from 6-year national BLS wage trends, was applied to project current 2026 compensation. Percentile ranges (P10–P90) represent the full salary distribution across experience levels and practice settings in this market.
Data Sources & Methodology
Salary data for Tumwater is estimated from official BLS state-level occupational wage data (2025), adjusted for regional cost-of-living differences using BEA RPP (Regional Price Parities).
2026 figures are projected from 2025 BLS data using a compound annual growth rate (CAGR) of 3.06%, derived from historical BLS wage trends for occupational therapists (SOC 29-1122).
Compiled and verified by Jordan Miller, OTR/L, a licensed occupational therapist with 10+ years of clinical experience. · View source data at BLS.gov