Occupational Therapist Salary in Yakima, WA: $114,809 (2026)
Quick Answer:A full-time occupational therapist in Yakima, WA earns a median $114,809/year (≈ $55.20/hour) in nominal terms for 2026 — projected from BLS OEWS 2025 (SOC 29-1122). Once you factor in Yakima's price level (4% below national, BEA RPP 95.5), that paycheck buys what $120,162 would nationally. Nominal pay sits 6.1% above the Washington state average.
Official BLS data · View source
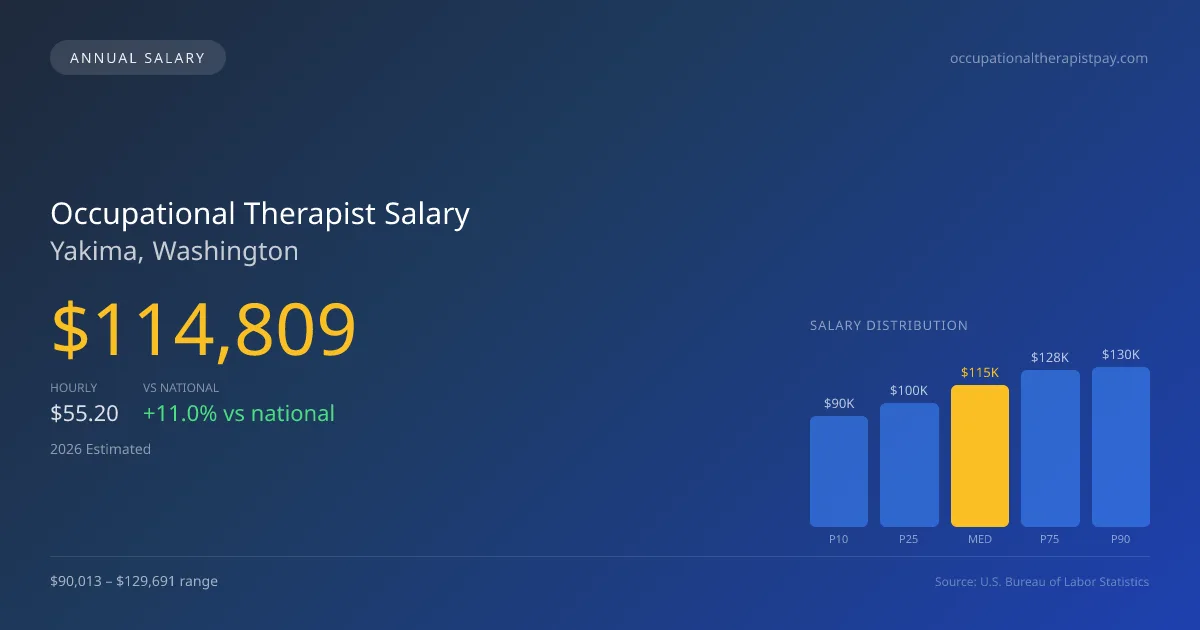
Occupational therapists in Yakima, Washington, are projected to earn a median annual salary of $114,809 in 2026, reflecting a competitive position compared to the national median of $103,400. This salary range spans from $90,013 at the 10th percentile to $129,691 at the 90th percentile, indicating a diverse job market for professionals in the field. These figures, sourced from official Bureau of Labor Statistics (BLS) OEWS surveys, highlight the implications of post-2022 Medicare cuts on compensation within skilled nursing facilities (SNFs) and outpatient settings. Despite these challenges, the growing demand for occupational therapy services presents opportunities for financial growth in Yakima's workforce.
Salary Breakdown
| Percentile | Annual | Hourly |
|---|---|---|
| Entry Level (P10) | $90,013 | $43.27 |
| Lower Range (P25) | $100,112 | $48.13 |
| Median (P50)(typical) | $114,809 | $55.20 |
| Upper Range (P75) | $127,619 | $61.36 |
| Top Earners (P90) | $129,691 | $62.35 |
Median Salary Position
11.03% above the national average
2026 Salary Percentile Distribution in Yakima
In Yakima, WA, the occupational therapist salary spread from the 10th to 90th percentile is $39,678 (2026 est.). At $114,809, the local median is 11.03% above the national median of $103,400.
Salary Calculator
At 40 hours/week in Yakima: You'd be above the median
How Yakima Occupational Therapist Pay Compares
Yakima median: $114,809/year (2026)
| Compared To | Median Salary | Yakima Pays |
|---|---|---|
| Washington Average | $108,208 | +6.10% more |
| National Average | $103,400 | +11.03% more |
Occupational Therapists in Yakima, WA earn a median of $114,809 per year (2026 est.), which is 11.03% higher than the national median of $103,400 and 6.10% above the Washington state average of $108,208.
Cost-of-Living Adjusted Salary
Yakima has a cost of living 4.45% below the national average, meaning your salary goes further here.
Adjusted salary = nominal × (100 / CoL index). CoL index: 100 = national average.
Yakima, WA has a cost-of-living index of 95.545 (below the national average of 100). A occupational therapist earning $114,809 nominally has purchasing power equivalent to $120,162 in an average-cost city — an effective 4.66% boost.
Compare Purchasing Power
Select a city to see how your salary compares after cost of living
Select a city above to compare purchasing power
2019 BLS Actual
$90,960
2025 BLS Actual
$111,400
2026 Current Est.
$114,809
2019–2027 Growth
+30.1%
Salary Trajectory for Occupational Therapists in Yakima (2019–2027)
2019–2025: actual BLS OEWS data for this metro area. 2026+: CAGR 3.06% projection.
| Year | Annual Salary | Status |
|---|---|---|
| 2019 | $90,960 | Actual |
| 2020 | $90,930 | Actual |
| 2021 | $96,730 | Actual |
| 2022 | $90,010 | Actual |
| 2023 | $96,100 | Actual |
| 2024 | $107,500 | Actual |
| 2025 | $111,400 | Actual |
| 2026(current) | $114,809 | Estimated |
| 2027 | $118,322 | Projected |
Based on 7 years of BLS OEWS data for the Yakima metropolitan area, the median occupational therapist salary grew 22.5% from $90,960 (2019) to $111,400 (2025). At a 3.06% compound annual growth rate, salaries are projected to reach $118,322 by 2027 — a total increase of $27,362 (30.08%) from 2019.
Note: Historical values (2019–2025) are actual BLS OEWS figures for the Yakima metropolitan area, sourced from annual Occupational Employment and Wage Statistics surveys. 2026–2026 figures are current estimates, and 2027 values are projections, calculated using a 3.06% CAGR derived from 7-year BLS historical data. Actual salaries may vary based on employer, experience, certifications, and local market conditions.
Salary by Experience Level
| Experience | Estimated Salary Range |
|---|---|
| 0-2 years (New Graduate) | $90,013 – $100,112 |
| 3-5 years (Mid Career) | $100,112 – $114,809 |
| 5+ years (Experienced) | $114,809 – $127,619 |
| 10+ years (Top Earner) | $127,619 – $129,691 |
OT, OTR salary ranges estimated from BLS percentile data. Individual occupational therapist compensation varies by employer, certifications, and specialization.
Occupational Therapist Job Market in Yakima
In Yakima, around 40 occupational therapists are employed, ensuring a steady job market for new graduates and seasoned therapists alike. The cost of living index for the area stands at 95.545, which suggests that take-home purchasing power is relatively favorable compared to national levels. Employers that typically offer the highest compensation include hospital inpatient rehabilitation centers and outpatient hand therapy clinics. The spread between lower and higher pay often hinges on factors such as work setting; therapists in hospitals generally earn more than those in schools or SNFs. Additionally, board certifications like the Certified Hand Therapist (CHT) often come with a premium, while productivity expectations and contractual work cycles further influence earnings. For those looking to maximize occupational therapist pay in Yakima WA, pursuing specialized certifications and considering opportunities in high-paying facilities are practical strategies to enhance overall income potential.
More salary data for Yakima, WA:
Frequently Asked Questions
How much do occupational therapists make in Yakima, WA in 2026?
Is Yakima, WA a good place to work as a occupational therapist?
Can occupational therapists make $100K in Yakima?
What is the cost-of-living adjusted occupational therapist salary in Yakima?
How much does a occupational therapist make per hour in Yakima?
Related Pages
Compare Salaries
Career Resources
Nearby Cities in Washington
Written by Jordan Miller, OTR/L
Career Analyst
Jordan has 10 years of experience in occupational therapy. They specialize in pediatrics and work in a rehabilitation clinic.
Methodology & Data Source
Salary figures on this page are 2026 projections based on the Bureau of Labor Statistics Occupational Employment and Wage Statistics (OEWS) survey, May 2026 release. The BLS reported a median annual salary of $111,400 for occupational therapistsin the Yakima metropolitan area. A 3.06% compound annual growth rate (CAGR), calculated from 6-year national BLS wage trends, was applied to project current 2026 compensation. Percentile ranges (P10–P90) represent the full salary distribution across experience levels and practice settings in this market.
Data Sources & Methodology
Source: BLS, OEWS, 7-year dataset (–). Per-city data from annual BLS metropolitan area surveys.
2026 figures are projected from 2025 BLS data using a compound annual growth rate (CAGR) of 3.06%, derived from historical BLS wage trends for occupational therapists (SOC 29-1122).
Compiled and verified by Jordan Miller, OTR/L, a licensed occupational therapist with 10+ years of clinical experience. · View source data at BLS.gov