Occupational Therapist Salary in Merrimack, NH: $108,132 (2026)
Quick Answer:A full-time occupational therapist in Merrimack, NH earns a median $108,132/year (≈ $51.98/hour) in nominal terms for 2026 — projected from BLS OEWS 2025 (SOC 29-1122). Once you factor in Merrimack's price level (7% above national, BEA RPP 107.3), that paycheck buys what $100,775 would nationally. Nominal pay sits 2.5% below the New Hampshire state average.
Based on BLS state-level estimates · View source
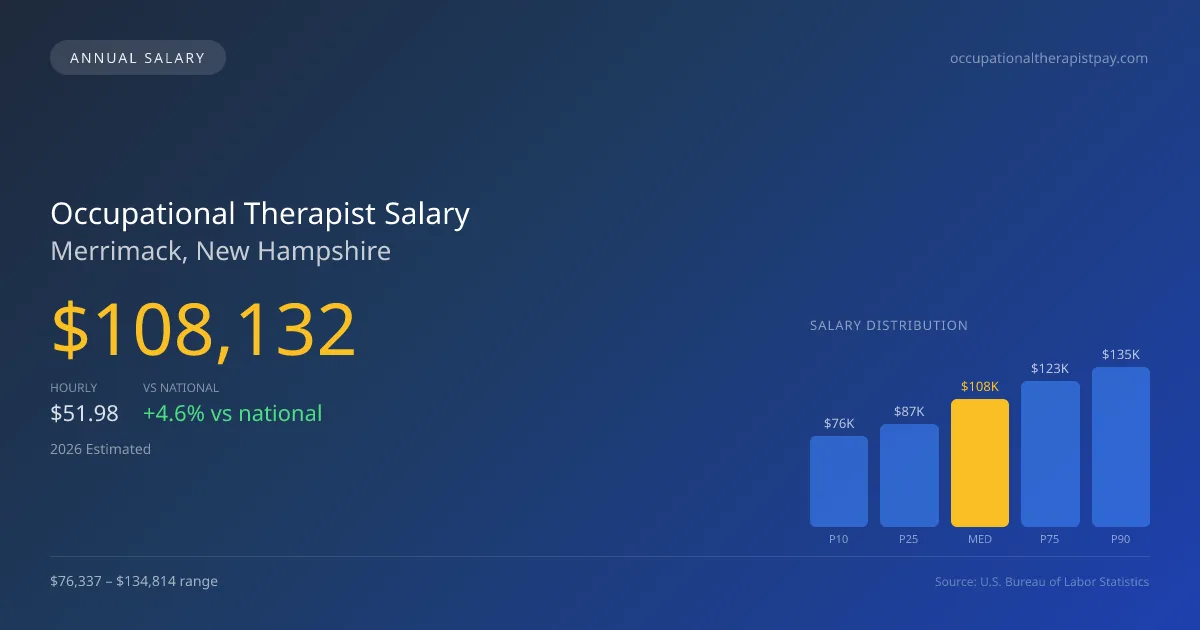
Occupational therapist salary in Merrimack, NH, is projected to reach a median annual figure of $108,132 in 2026, reflecting local adjustments influenced by the ongoing impact of Medicare cuts on skilled nursing facilities and outpatient therapy compensation since 2022. The salary range for this profession spans from $76,337 at the 10th percentile to $134,814 at the 90th percentile, indicating a substantial wage variation based on experience, setting, and specific employer. These figures are informed by estimates based on 2025 BLS data and regional price parity adjustments, demonstrating Merrimack's competitive compensation for occupational therapists compared to the national median of $103,400.
About the Merrimack Market
Salary estimated from New Hampshire average ($92,000) adjusted for local cost of living.
Salary Breakdown
| Percentile | Annual | Hourly |
|---|---|---|
| Entry Level (P10) | $76,337 | $36.70 |
| Lower Range (P25) | $87,102 | $41.87 |
| Median (P50)(typical) | $108,132 | $51.98 |
| Upper Range (P75) | $122,651 | $58.97 |
| Top Earners (P90) | $134,814 | $64.81 |
Median Salary Position
4.58% above the national average
2026 Salary Percentile Distribution in Merrimack
In Merrimack, NH, the occupational therapist salary spread from the 10th to 90th percentile is $58,477 (2026 est.). At $108,132, the local median is 4.58% above the national median of $103,400.
Salary Calculator
At 40 hours/week in Merrimack: You'd be above the median
How Merrimack Occupational Therapist Pay Compares
Merrimack median: $108,132/year (2026)
| Compared To | Median Salary | Merrimack Pays |
|---|---|---|
| New Hampshire Average | $110,904 | -2.50% less |
| National Average | $103,400 | +4.58% more |
Occupational Therapists in Merrimack, NH earn a median of $108,132 per year (2026 est.), which is 4.58% higher than the national median of $103,400 and 2.50% below the New Hampshire state average of $110,904.
Cost-of-Living Adjusted Salary
Merrimack has a cost of living 7.30% above the national average.
Adjusted salary = nominal × (100 / CoL index). CoL index: 100 = national average.
Merrimack, NH has a cost-of-living index of 107.3 (above the national average of 100). While the nominal salary of $108,132 is competitive, the higher cost of living reduces purchasing power to an effective $100,775 — a 6.8% reduction.
Compare Purchasing Power
Select a city to see how your salary compares after cost of living
Select a city above to compare purchasing power
2019 BLS Actual
$88,837
2025 BLS Actual
$104,921
2026 Current Est.
$108,132
2019–2027 Growth
+25.4%
Salary Trajectory for Occupational Therapists in Merrimack (2019–2027)
2019–2025: actual BLS OEWS data for this metro area. 2026+: CAGR 3.06% projection.
| Year | Annual Salary | Status |
|---|---|---|
| 2019 | $88,837 | Actual |
| 2020 | $90,228 | Actual |
| 2021 | $89,486 | Actual |
| 2022 | $97,444 | Actual |
| 2023 | $100,780 | Actual |
| 2024 | $96,210 | Actual |
| 2025 | $104,921 | Actual |
| 2026(current) | $108,132 | Estimated |
| 2027 | $111,440 | Projected |
Based on 7 years of BLS OEWS data for the Merrimack metropolitan area, the median occupational therapist salary grew 18.1% from $88,837 (2019) to $104,921 (2025). At a 3.06% compound annual growth rate, salaries are projected to reach $111,440 by 2027 — a total increase of $22,603 (25.44%) from 2019.
Note: Historical values (2019–2025) are actual BLS OEWS figures for the Merrimack metropolitan area, sourced from annual Occupational Employment and Wage Statistics surveys. 2026–2026 figures are current estimates, and 2027 values are projections, calculated using a 3.06% CAGR derived from 7-year BLS historical data. Actual salaries may vary based on employer, experience, certifications, and local market conditions.
Salary by Experience Level
| Experience | Estimated Salary Range |
|---|---|
| 0-2 years (New Graduate) | $76,337 – $87,102 |
| 3-5 years (Mid Career) | $87,102 – $108,132 |
| 5+ years (Experienced) | $108,132 – $122,651 |
| 10+ years (Top Earner) | $122,651 – $134,814 |
OT, OTR salary ranges estimated from BLS percentile data. Individual occupational therapist compensation varies by employer, certifications, and specialization.
Occupational Therapist Job Market in Merrimack
Merrimack's job market currently employs five occupational therapists, suggesting a relatively stable sector within the community. The cost of living index stands at 107.3, which slightly elevates the financial demands on residents, potentially impacting take-home pay. Among local employers, skilled nursing facilities often offer the highest salaries, typically followed by hospital inpatient rehab and specialized hand therapy clinics, while school districts and early intervention programs may pay lower due to summer breaks and contract limitations. The disparity between pay levels is driven by factors such as patient productivity requirements, the setting in which therapists work, and the level of specialization—those with credentials like the Certified Hand Therapist (CHT) can command higher rates. For optimal compensation in this local market, occupational therapists should consider obtaining specialized board certifications, focusing on productivity, and being open to diverse employment settings, which can enhance their overall earnings potential in Merrimack, NH.
More salary data for Merrimack, NH:
Frequently Asked Questions
How much do occupational therapists make in Merrimack, NH in 2026?
Is Merrimack, NH a good place to work as a occupational therapist?
Can occupational therapists make $100K in Merrimack?
What is the cost-of-living adjusted occupational therapist salary in Merrimack?
How much does a occupational therapist make per hour in Merrimack?
Related Pages
Compare Salaries
Career Resources
Nearby Cities in New Hampshire
Written by Jordan Miller, OTR/L
Career Analyst
Jordan has 10 years of experience in occupational therapy. They specialize in pediatrics and work in a rehabilitation clinic.
Methodology & Data Source
Salary figures on this page are 2026 projections based on the Bureau of Labor Statistics Occupational Employment and Wage Statistics (OEWS) survey, May 2026 release. The BLS reported a median annual salary of $104,921 for occupational therapistsin the Merrimack metropolitan area. A 3.06% compound annual growth rate (CAGR), calculated from 6-year national BLS wage trends, was applied to project current 2026 compensation. Percentile ranges (P10–P90) represent the full salary distribution across experience levels and practice settings in this market.
Data Sources & Methodology
Salary data for Merrimack is estimated from official BLS state-level occupational wage data (2025), adjusted for regional cost-of-living differences using BEA RPP (Regional Price Parities).
2026 figures are projected from 2025 BLS data using a compound annual growth rate (CAGR) of 3.06%, derived from historical BLS wage trends for occupational therapists (SOC 29-1122).
Compiled and verified by Jordan Miller, OTR/L, a licensed occupational therapist with 10+ years of clinical experience. · View source data at BLS.gov