Occupational Therapist Salary in Arlington, TX: $107,148 (2026)
Quick Answer:A full-time occupational therapist in Arlington, TX earns a median $107,148/year (≈ $51.51/hour) in nominal terms for 2026 — projected from BLS OEWS 2025 (SOC 29-1122). Once you factor in Arlington's price level (4% below national, BEA RPP 96.0), that paycheck buys what $111,613 would nationally. Nominal pay sits 1.6% above the Texas state average.
Based on BLS state-level estimates · View source
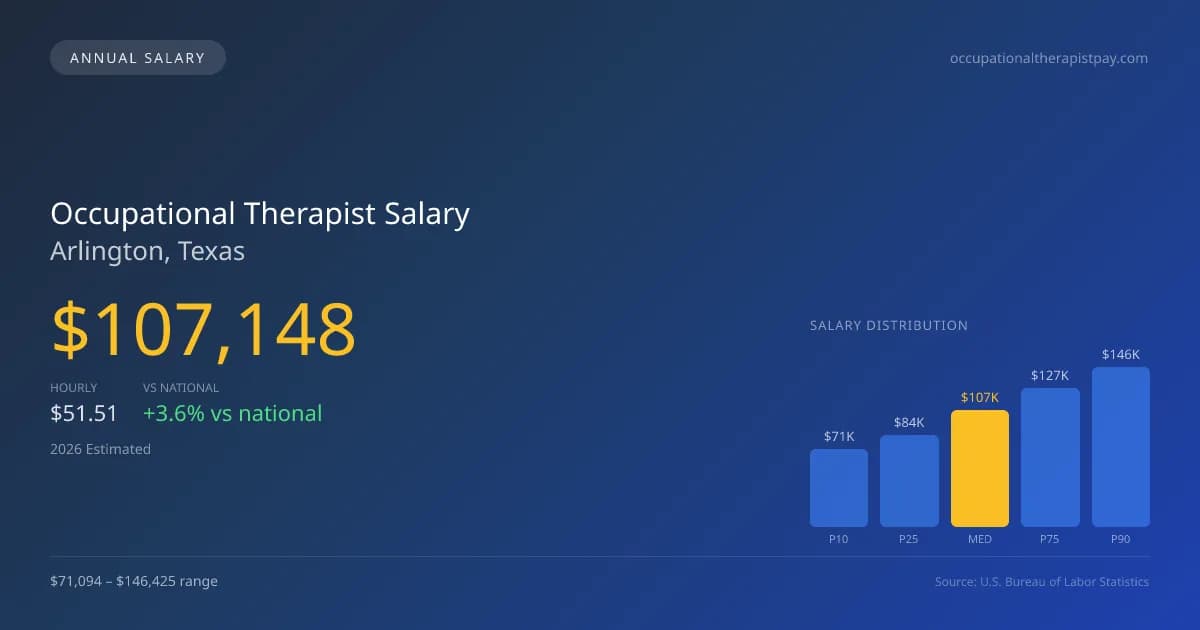
Occupational therapists in Arlington, TX, can expect a median annual salary of $107,148 in 2026, reflecting a competitive local market. The salary range spans from $71,094 at the 10th percentile to $146,425 at the 90th percentile, providing a clear spectrum of earning potential depending on experience and workplace setting. These figures are derived from estimates based on 2025 BLS data, with regional price adjustments considered. The choice between working in hospitals, skilled nursing facilities (SNFs), or school systems impacts salaries significantly. Therapists in hospital settings often see higher compensation due to the nature of care and demand, while those in schools may opt for a school-year contract with less pay but more predictable schedules.
About the Arlington Market
Salary estimated from Texas average ($98,000) adjusted for local cost of living.
Salary Breakdown
| Percentile | Annual | Hourly |
|---|---|---|
| Entry Level (P10) | $71,094 | $34.17 |
| Lower Range (P25) | $83,810 | $40.30 |
| Median (P50)(typical) | $107,148 | $51.51 |
| Upper Range (P75) | $127,260 | $61.19 |
| Top Earners (P90) | $146,425 | $70.40 |
Median Salary Position
3.62% above the national average
2026 Salary Percentile Distribution in Arlington
In Arlington, TX, the occupational therapist salary spread from the 10th to 90th percentile is $75,331 (2026 est.). At $107,148, the local median is 3.62% above the national median of $103,400.
Salary Calculator
At 40 hours/week in Arlington: You'd be in the lower-middle range
How Arlington Occupational Therapist Pay Compares
Arlington median: $107,148/year (2026)
| Compared To | Median Salary | Arlington Pays |
|---|---|---|
| Texas Average | $105,461 | +1.60% more |
| National Average | $103,400 | +3.62% more |
Occupational Therapists in Arlington, TX earn a median of $107,148 per year (2026 est.), which is 3.62% higher than the national median of $103,400 and 1.60% above the Texas state average of $105,461.
Cost-of-Living Adjusted Salary
Arlington has a cost of living 4.00% below the national average, meaning your salary goes further here.
Adjusted salary = nominal × (100 / CoL index). CoL index: 100 = national average.
Arlington, TX has a cost-of-living index of 96 (below the national average of 100). A occupational therapist earning $107,148 nominally has purchasing power equivalent to $111,613 in an average-cost city — an effective 4.17% boost.
Compare Purchasing Power
Select a city to see how your salary compares after cost of living
Select a city above to compare purchasing power
2019 BLS Actual
$88,029
2025 BLS Actual
$103,967
2026 Current Est.
$107,148
2019–2027 Growth
+25.4%
Salary Trajectory for Occupational Therapists in Arlington (2019–2027)
2019–2025: actual BLS OEWS data for this metro area. 2026+: CAGR 3.06% projection.
| Year | Annual Salary | Status |
|---|---|---|
| 2019 | $88,029 | Actual |
| 2020 | $89,408 | Actual |
| 2021 | $88,672 | Actual |
| 2022 | $96,558 | Actual |
| 2023 | $99,863 | Actual |
| 2024 | $96,789 | Actual |
| 2025 | $103,967 | Actual |
| 2026(current) | $107,148 | Estimated |
| 2027 | $110,427 | Projected |
Based on 7 years of BLS OEWS data for the Arlington metropolitan area, the median occupational therapist salary grew 18.1% from $88,029 (2019) to $103,967 (2025). At a 3.06% compound annual growth rate, salaries are projected to reach $110,427 by 2027 — a total increase of $22,398 (25.44%) from 2019.
Note: Historical values (2019–2025) are actual BLS OEWS figures for the Arlington metropolitan area, sourced from annual Occupational Employment and Wage Statistics surveys. 2026–2026 figures are current estimates, and 2027 values are projections, calculated using a 3.06% CAGR derived from 7-year BLS historical data. Actual salaries may vary based on employer, experience, certifications, and local market conditions.
Salary by Experience Level
| Experience | Estimated Salary Range |
|---|---|
| 0-2 years (New Graduate) | $71,094 – $83,810 |
| 3-5 years (Mid Career) | $83,810 – $107,148 |
| 5+ years (Experienced) | $107,148 – $127,260 |
| 10+ years (Top Earner) | $127,260 – $146,425 |
OT, OTR salary ranges estimated from BLS percentile data. Individual occupational therapist compensation varies by employer, certifications, and specialization.
Occupational Therapist Job Market in Arlington
In Arlington, 83 occupational therapists are currently employed, which highlights a stable job market for this profession. The cost of living is slightly below the national average, with a cost-of-living index of 96, ensuring that take-home pay has a respectable purchasing power. Positions in skilled nursing facilities and inpatient rehabilitation hospitals tend to offer the highest wages among local employers. Factors determining salary variations include setting type—hospitals generally pay more than schools and SNFs—as well as specialized credentials like the Certified Hand Therapist (CHT) that command a premium. Furthermore, productivity expectations and the financial impact of Medicare cuts on SNFs can drive the income range. To maximize their occupational therapist pay in Arlington TX, professionals may focus on gaining specialized certifications and consider opportunities within high-paying healthcare settings.
More salary data for Arlington, TX:
Frequently Asked Questions
How much do occupational therapists make in Arlington, TX in 2026?
Is Arlington, TX a good place to work as a occupational therapist?
Can occupational therapists make $100K in Arlington?
What is the cost-of-living adjusted occupational therapist salary in Arlington?
How much does a occupational therapist make per hour in Arlington?
Related Pages
Compare Salaries
Career Resources
Nearby Cities in Texas
Written by Jordan Miller, OTR/L
Career Analyst
Jordan has 10 years of experience in occupational therapy. They specialize in pediatrics and work in a rehabilitation clinic.
Methodology & Data Source
Salary figures on this page are 2026 projections based on the Bureau of Labor Statistics Occupational Employment and Wage Statistics (OEWS) survey, May 2026 release. The BLS reported a median annual salary of $103,967 for occupational therapistsin the Arlington metropolitan area. A 3.06% compound annual growth rate (CAGR), calculated from 6-year national BLS wage trends, was applied to project current 2026 compensation. Percentile ranges (P10–P90) represent the full salary distribution across experience levels and practice settings in this market.
Data Sources & Methodology
Salary data for Arlington is estimated from official BLS state-level occupational wage data (2025), adjusted for regional cost-of-living differences using BEA RPP (Regional Price Parities).
2026 figures are projected from 2025 BLS data using a compound annual growth rate (CAGR) of 3.06%, derived from historical BLS wage trends for occupational therapists (SOC 29-1122).
Compiled and verified by Jordan Miller, OTR/L, a licensed occupational therapist with 10+ years of clinical experience. · View source data at BLS.gov