Occupational Therapist Salary in Benbrook, TX: $100,059 (2026)
Quick Answer:A full-time occupational therapist in Benbrook, TX earns a median $100,059/year (≈ $48.11/hour) in nominal terms for 2026 — projected from BLS OEWS 2025 (SOC 29-1122). Once you factor in Benbrook's price level (4% below national, BEA RPP 96.0), that paycheck buys what $104,228 would nationally. Nominal pay sits 5.2% below the Texas state average.
Based on BLS state-level estimates · View source
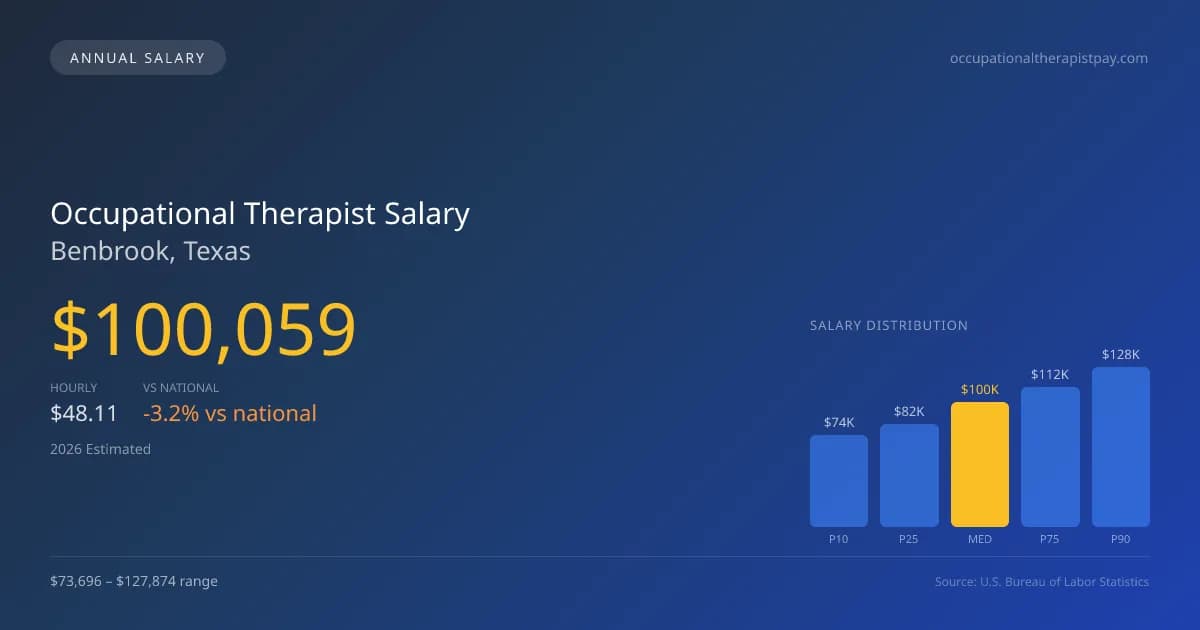
Occupational therapists in Benbrook, Texas, can expect a median annual salary of $100,059 in 2026, reflecting the nuanced landscape of healthcare employment in the area. The salary range is broad, with entry-level positions starting at $73,696 (P10) and highly experienced therapists earning up to $127,874 (P90). These figures, derived from 2025 BLS data and adjusted for local cost of living, highlight the differences in occupational therapist pay in Benbrook, TX. Employment settings such as hospitals, skilled nursing facilities, and outpatient clinics play a critical role in determining compensation, along with the choice between year-round and school-year contracts. Given Benbrook's proximity to Fort Worth, local job opportunities in various rehabilitation settings can significantly influence market dynamics and salary offerings for occupational therapists.
About the Benbrook Market
Salary estimated from Texas average ($98,000) adjusted for local cost of living.
Salary Breakdown
| Percentile | Annual | Hourly |
|---|---|---|
| Entry Level (P10) | $73,696 | $35.43 |
| Lower Range (P25) | $82,381 | $39.61 |
| Median (P50)(typical) | $100,059 | $48.11 |
| Upper Range (P75) | $112,125 | $53.91 |
| Top Earners (P90) | $127,874 | $61.48 |
Median Salary Position
3.23% below the national average
2026 Salary Percentile Distribution in Benbrook
In Benbrook, TX, the occupational therapist salary spread from the 10th to 90th percentile is $54,178 (2026 est.). At $100,059, the local median is 3.23% below the national median of $103,400.
Salary Calculator
At 40 hours/week in Benbrook: You'd be in the lower-middle range
How Benbrook Occupational Therapist Pay Compares
Benbrook median: $100,059/year (2026)
| Compared To | Median Salary | Benbrook Pays |
|---|---|---|
| Texas Average | $105,547 | -5.20% less |
| National Average | $103,400 | -3.23% less |
Occupational Therapists in Benbrook, TX earn a median of $100,059 per year (2026 est.), which is 3.23% lower than the national median of $103,400 and 5.20% below the Texas state average of $105,547.
Cost-of-Living Adjusted Salary
Benbrook has a cost of living 4.00% below the national average, meaning your salary goes further here.
Adjusted salary = nominal × (100 / CoL index). CoL index: 100 = national average.
Benbrook, TX has a cost-of-living index of 96 (below the national average of 100). A occupational therapist earning $100,059 nominally has purchasing power equivalent to $104,228 in an average-cost city — an effective 4.17% boost.
Compare Purchasing Power
Select a city to see how your salary compares after cost of living
Select a city above to compare purchasing power
2019 BLS Actual
$82,205
2025 BLS Actual
$97,088
2026 Current Est.
$100,059
2019–2027 Growth
+25.4%
Salary Trajectory for Occupational Therapists in Benbrook (2019–2027)
2019–2025: actual BLS OEWS data for this metro area. 2026+: CAGR 3.06% projection.
| Year | Annual Salary | Status |
|---|---|---|
| 2019 | $82,205 | Actual |
| 2020 | $83,492 | Actual |
| 2021 | $82,805 | Actual |
| 2022 | $90,169 | Actual |
| 2023 | $93,256 | Actual |
| 2024 | $89,217 | Actual |
| 2025 | $97,088 | Actual |
| 2026(current) | $100,059 | Estimated |
| 2027 | $103,121 | Projected |
Based on 7 years of BLS OEWS data for the Benbrook metropolitan area, the median occupational therapist salary grew 18.1% from $82,205 (2019) to $97,088 (2025). At a 3.06% compound annual growth rate, salaries are projected to reach $103,121 by 2027 — a total increase of $20,916 (25.44%) from 2019.
Note: Historical values (2019–2025) are actual BLS OEWS figures for the Benbrook metropolitan area, sourced from annual Occupational Employment and Wage Statistics surveys. 2026–2026 figures are current estimates, and 2027 values are projections, calculated using a 3.06% CAGR derived from 7-year BLS historical data. Actual salaries may vary based on employer, experience, certifications, and local market conditions.
Salary by Experience Level
| Experience | Estimated Salary Range |
|---|---|
| 0-2 years (New Graduate) | $73,696 – $82,381 |
| 3-5 years (Mid Career) | $82,381 – $100,059 |
| 5+ years (Experienced) | $100,059 – $112,125 |
| 10+ years (Top Earner) | $112,125 – $127,874 |
OT, OTR salary ranges estimated from BLS percentile data. Individual occupational therapist compensation varies by employer, certifications, and specialization.
Occupational Therapist Job Market in Benbrook
The job market in Benbrook shows potential stability with only six occupational therapists currently employed, indicating a niche but established field of practitioners. This limited workforce coincides with a cost of living index of 96, which suggests that occupational therapist salaries in Benbrook, while slightly below the national median, provide reasonable buying power within the local economy. Among various employers, skilled nursing facilities and hospital inpatient rehabilitation settings tend to offer higher pay, driven by the demand for specialized rehabilitation services. Factors such as CHT certification, productivity expectations, and the contrast between school contracts and year-round roles can create a noticeable disparity in compensation. For occupational therapists looking to maximize their earning potential in Benbrook, pursuing specialized certifications and seeking employment in higher-paying facilities may yield better financial outcomes in this evolving healthcare market.
More salary data for Benbrook, TX:
Frequently Asked Questions
How much do occupational therapists make in Benbrook, TX in 2026?
Is Benbrook, TX a good place to work as a occupational therapist?
Can occupational therapists make $100K in Benbrook?
What is the cost-of-living adjusted occupational therapist salary in Benbrook?
How much does a occupational therapist make per hour in Benbrook?
Related Pages
Compare Salaries
Career Resources
Nearby Cities in Texas
Written by Jordan Miller, OTR/L
Career Analyst
Jordan has 10 years of experience in occupational therapy. They specialize in pediatrics and work in a rehabilitation clinic.
Methodology & Data Source
Salary figures on this page are 2026 projections based on the Bureau of Labor Statistics Occupational Employment and Wage Statistics (OEWS) survey, May 2026 release. The BLS reported a median annual salary of $97,088 for occupational therapistsin the Benbrook metropolitan area. A 3.06% compound annual growth rate (CAGR), calculated from 6-year national BLS wage trends, was applied to project current 2026 compensation. Percentile ranges (P10–P90) represent the full salary distribution across experience levels and practice settings in this market.
Data Sources & Methodology
Salary data for Benbrook is estimated from official BLS state-level occupational wage data (2025), adjusted for regional cost-of-living differences using BEA RPP (Regional Price Parities).
2026 figures are projected from 2025 BLS data using a compound annual growth rate (CAGR) of 3.06%, derived from historical BLS wage trends for occupational therapists (SOC 29-1122).
Compiled and verified by Jordan Miller, OTR/L, a licensed occupational therapist with 10+ years of clinical experience. · View source data at BLS.gov