Occupational Therapist Salary in Sterling, VA: $98,291 (2026)
Quick Answer:A full-time occupational therapist in Sterling, VA earns a median $98,291/year (≈ $47.25/hour) in nominal terms for 2026 — projected from BLS OEWS 2025 (SOC 29-1122). Once you factor in Sterling's price level (3% above national, BEA RPP 103.2), that paycheck buys what $95,243 would nationally. Nominal pay sits 4.1% below the Virginia state average.
Based on BLS state-level estimates · View source
Occupational therapists in Sterling, Virginia, can expect a median annual salary of $98,291 in 2026. This figure reflects local estimates based on 2025 BLS data and regional cost adjustments. Compensation ranges widely from $74,656 at the P10 level to $125,871 at the P90 level, indicating diverse opportunities across settings. Hospital environments typically offer higher pay compared to schools and skilled nursing facilities, while year-round contracts may provide more consistent income compared to school-year positions. The choices therapists make regarding employment settings and contract types significantly impact their earnings potential in this vibrant market.
About the Sterling Market
Salary estimated from Virginia average ($90,000) adjusted for local cost of living.
Salary Breakdown
| Percentile | Annual | Hourly |
|---|---|---|
| Entry Level (P10) | $74,656 | $35.90 |
| Lower Range (P25) | $81,111 | $39.00 |
| Median (P50)(typical) | $98,291 | $47.25 |
| Upper Range (P75) | $113,292 | $54.47 |
| Top Earners (P90) | $125,871 | $60.52 |
Median Salary Position
4.94% below the national average
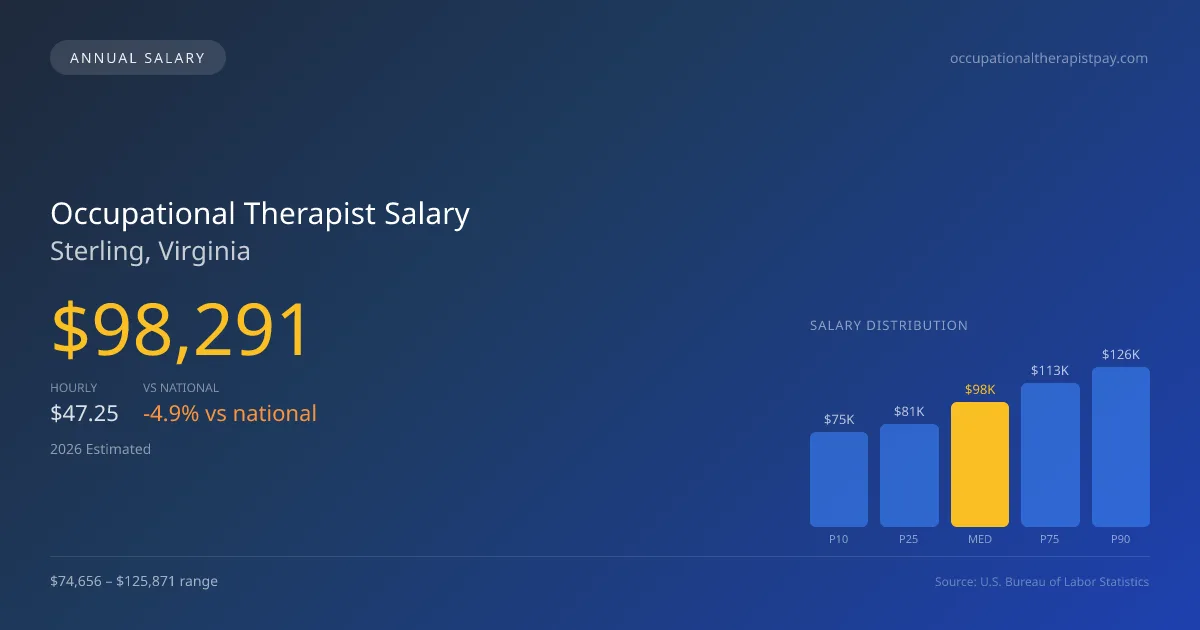
2026 Salary Percentile Distribution in Sterling
In Sterling, VA, the occupational therapist salary spread from the 10th to 90th percentile is $51,215 (2026 est.). At $98,291, the local median is 4.94% below the national median of $103,400.
Salary Calculator
At 40 hours/week in Sterling: You'd be in the lower-middle range
How Sterling Occupational Therapist Pay Compares
Sterling median: $98,291/year (2026)
| Compared To | Median Salary | Sterling Pays |
|---|---|---|
| Virginia Average | $102,494 | -4.10% less |
| National Average | $103,400 | -4.94% less |
Occupational Therapists in Sterling, VA earn a median of $98,291 per year (2026 est.), which is 4.94% lower than the national median of $103,400 and 4.10% below the Virginia state average of $102,494.
Cost-of-Living Adjusted Salary
Sterling has a cost of living 3.20% above the national average.
Adjusted salary = nominal × (100 / CoL index). CoL index: 100 = national average.
Sterling, VA has a cost-of-living index of 103.2 (above the national average of 100). While the nominal salary of $98,291 is competitive, the higher cost of living reduces purchasing power to an effective $95,243 — a 3.1% reduction.
Compare Purchasing Power
Select a city to see how your salary compares after cost of living
Select a city above to compare purchasing power
2019 BLS Actual
$80,753
2025 BLS Actual
$95,373
2026 Current Est.
$98,291
2019–2027 Growth
+25.4%
Salary Trajectory for Occupational Therapists in Sterling (2019–2027)
2019–2025: actual BLS OEWS data for this metro area. 2026+: CAGR 3.06% projection.
| Year | Annual Salary | Status |
|---|---|---|
| 2019 | $80,753 | Actual |
| 2020 | $82,017 | Actual |
| 2021 | $81,342 | Actual |
| 2022 | $88,576 | Actual |
| 2023 | $91,609 | Actual |
| 2024 | $89,117 | Actual |
| 2025 | $95,373 | Actual |
| 2026(current) | $98,291 | Estimated |
| 2027 | $101,299 | Projected |
Based on 7 years of BLS OEWS data for the Sterling metropolitan area, the median occupational therapist salary grew 18.1% from $80,753 (2019) to $95,373 (2025). At a 3.06% compound annual growth rate, salaries are projected to reach $101,299 by 2027 — a total increase of $20,546 (25.44%) from 2019.
Note: Historical values (2019–2025) are actual BLS OEWS figures for the Sterling metropolitan area, sourced from annual Occupational Employment and Wage Statistics surveys. 2026–2026 figures are current estimates, and 2027 values are projections, calculated using a 3.06% CAGR derived from 7-year BLS historical data. Actual salaries may vary based on employer, experience, certifications, and local market conditions.
Salary by Experience Level
| Experience | Estimated Salary Range |
|---|---|
| 0-2 years (New Graduate) | $74,656 – $81,111 |
| 3-5 years (Mid Career) | $81,111 – $98,291 |
| 5+ years (Experienced) | $98,291 – $113,292 |
| 10+ years (Top Earner) | $113,292 – $125,871 |
OT, OTR salary ranges estimated from BLS percentile data. Individual occupational therapist compensation varies by employer, certifications, and specialization.
Occupational Therapist Job Market in Sterling
In Sterling, the job market for occupational therapists consists of a small but focused community, with only seven professionals currently employed in the area. The cost-of-living index stands at 103.2, indicating that while salaries may seem competitive, actual take-home purchasing power can be considerably affected by local expenses. Notably, skilled nursing facilities and hospital rehab units are likely to offer the most lucrative positions, especially for those holding specialized certifications such as a Certified Hand Therapist (CHT) or other board credentials. The disparity in salaries is influenced by factors such as productivity expectations and the impact of Medicare cuts on pay rates in outpatient and SNF roles. To maximize earning potential, therapists in Sterling may consider pursuing additional certifications, establishing relationships with high-paying employers, or seeking positions that emphasize board specialty skills.
More salary data for Sterling, VA:
Frequently Asked Questions
How much do occupational therapists make in Sterling, VA in 2026?
Is Sterling, VA a good place to work as a occupational therapist?
Can occupational therapists make $100K in Sterling?
What is the cost-of-living adjusted occupational therapist salary in Sterling?
How much does a occupational therapist make per hour in Sterling?
Related Pages
Compare Salaries
Career Resources
Nearby Cities in Virginia
Written by Jordan Miller, OTR/L
Career Analyst
Jordan has 10 years of experience in occupational therapy. They specialize in pediatrics and work in a rehabilitation clinic.
Methodology & Data Source
Salary figures on this page are 2026 projections based on the Bureau of Labor Statistics Occupational Employment and Wage Statistics (OEWS) survey, May 2026 release. The BLS reported a median annual salary of $95,373 for occupational therapistsin the Sterling metropolitan area. A 3.06% compound annual growth rate (CAGR), calculated from 6-year national BLS wage trends, was applied to project current 2026 compensation. Percentile ranges (P10–P90) represent the full salary distribution across experience levels and practice settings in this market.
Data Sources & Methodology
Salary data for Sterling is estimated from official BLS state-level occupational wage data (2025), adjusted for regional cost-of-living differences using BEA RPP (Regional Price Parities).
2026 figures are projected from 2025 BLS data using a compound annual growth rate (CAGR) of 3.06%, derived from historical BLS wage trends for occupational therapists (SOC 29-1122).
Compiled and verified by Jordan Miller, OTR/L, a licensed occupational therapist with 10+ years of clinical experience. · View source data at BLS.gov