Occupational Therapist Salary in Berwyn, IL: $98,396 (2026)
Quick Answer:A full-time occupational therapist in Berwyn, IL earns a median $98,396/year (≈ $47.30/hour) in nominal terms for 2026 — projected from BLS OEWS 2025 (SOC 29-1122). Once you factor in Berwyn's price level (3% below national, BEA RPP 97.1), that paycheck buys what $101,335 would nationally. Nominal pay sits 1.2% below the Illinois state average.
Based on BLS state-level estimates · View source
In 2026, projected occupational therapist salaries in Berwyn, Illinois, are estimated to reach a median of $98,396, slightly trailing the national median of $103,400. The local salary range spans from $66,435 at the 10th percentile to $125,415 at the 90th percentile, indicating a competitive market despite the impact of Medicare cuts on skilled nursing facility and outpatient therapy compensation post-2022. These figures are derived from estimates based on 2025 BLS data and regional cost adjustments, reflecting the unique economic climate in Berwyn. With the area hosting a limited number of occupational therapists—only 12 employed locally—competition for positions among skilled practitioners can be fierce.
About the Berwyn Market
Salary estimated from Illinois average ($92,000) adjusted for local cost of living.
Salary Breakdown
| Percentile | Annual | Hourly |
|---|---|---|
| Entry Level (P10) | $66,435 | $31.94 |
| Lower Range (P25) | $83,182 | $39.99 |
| Median (P50)(typical) | $98,396 | $47.30 |
| Upper Range (P75) | $112,460 | $54.07 |
| Top Earners (P90) | $125,415 | $60.30 |
Median Salary Position
4.84% below the national average
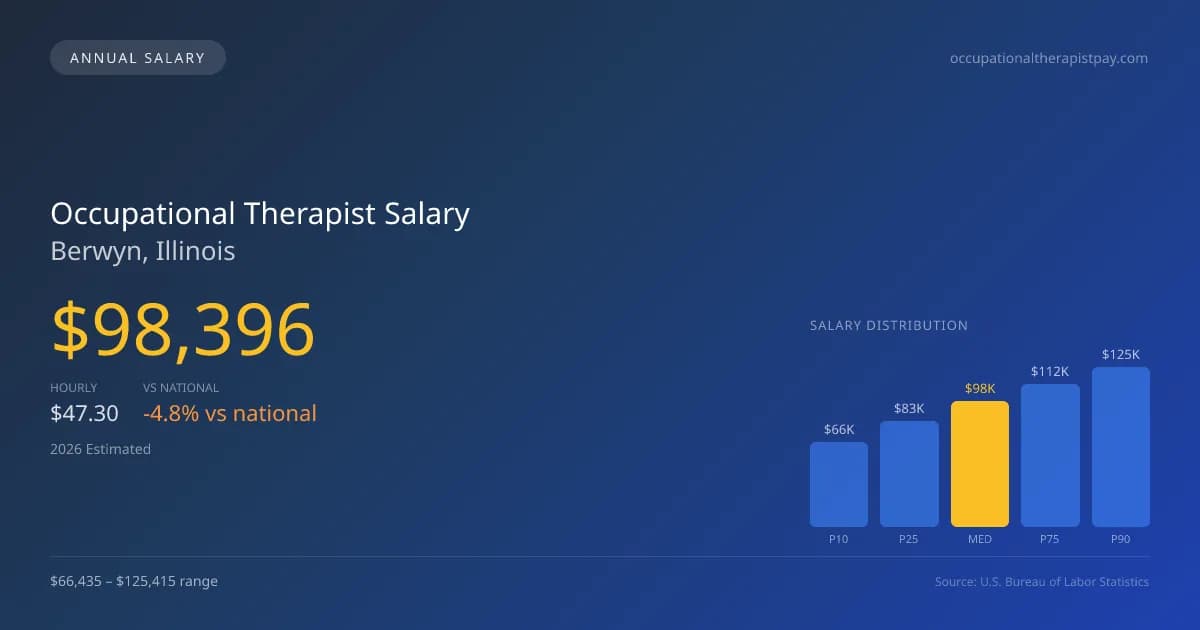
2026 Salary Percentile Distribution in Berwyn
In Berwyn, IL, the occupational therapist salary spread from the 10th to 90th percentile is $58,980 (2026 est.). At $98,396, the local median is 4.84% below the national median of $103,400.
Salary Calculator
At 40 hours/week in Berwyn: You'd be above the median
How Berwyn Occupational Therapist Pay Compares
Berwyn median: $98,396/year (2026)
| Compared To | Median Salary | Berwyn Pays |
|---|---|---|
| Illinois Average | $99,591 | -1.20% less |
| National Average | $103,400 | -4.84% less |
Occupational Therapists in Berwyn, IL earn a median of $98,396 per year (2026 est.), which is 4.84% lower than the national median of $103,400 and 1.20% below the Illinois state average of $99,591.
Cost-of-Living Adjusted Salary
Berwyn has a cost of living 2.90% below the national average, meaning your salary goes further here.
Adjusted salary = nominal × (100 / CoL index). CoL index: 100 = national average.
Berwyn, IL has a cost-of-living index of 97.1 (below the national average of 100). A occupational therapist earning $98,396 nominally has purchasing power equivalent to $101,335 in an average-cost city — an effective 2.99% boost.
Compare Purchasing Power
Select a city to see how your salary compares after cost of living
Select a city above to compare purchasing power
2019 BLS Actual
$80,838
2025 BLS Actual
$95,474
2026 Current Est.
$98,396
2019–2027 Growth
+25.4%
Salary Trajectory for Occupational Therapists in Berwyn (2019–2027)
2019–2025: actual BLS OEWS data for this metro area. 2026+: CAGR 3.06% projection.
| Year | Annual Salary | Status |
|---|---|---|
| 2019 | $80,838 | Actual |
| 2020 | $82,104 | Actual |
| 2021 | $81,428 | Actual |
| 2022 | $88,670 | Actual |
| 2023 | $91,706 | Actual |
| 2024 | $88,272 | Actual |
| 2025 | $95,474 | Actual |
| 2026(current) | $98,396 | Estimated |
| 2027 | $101,406 | Projected |
Based on 7 years of BLS OEWS data for the Berwyn metropolitan area, the median occupational therapist salary grew 18.1% from $80,838 (2019) to $95,474 (2025). At a 3.06% compound annual growth rate, salaries are projected to reach $101,406 by 2027 — a total increase of $20,568 (25.44%) from 2019.
Note: Historical values (2019–2025) are actual BLS OEWS figures for the Berwyn metropolitan area, sourced from annual Occupational Employment and Wage Statistics surveys. 2026–2026 figures are current estimates, and 2027 values are projections, calculated using a 3.06% CAGR derived from 7-year BLS historical data. Actual salaries may vary based on employer, experience, certifications, and local market conditions.
Salary by Experience Level
| Experience | Estimated Salary Range |
|---|---|
| 0-2 years (New Graduate) | $66,435 – $83,182 |
| 3-5 years (Mid Career) | $83,182 – $98,396 |
| 5+ years (Experienced) | $98,396 – $112,460 |
| 10+ years (Top Earner) | $112,460 – $125,415 |
OT, OTR salary ranges estimated from BLS percentile data. Individual occupational therapist compensation varies by employer, certifications, and specialization.
Occupational Therapist Job Market in Berwyn
The cost of living in Berwyn, rated at 97.1 on the index, implies that take-home pay may stretch further than in higher-cost areas, offering some financial relief for occupational therapists working in the region. Among the local employers, skilled nursing facilities and outpatient clinics typically offer the highest compensation, influenced by the specific setting’s demands and reimbursement rates. Factors such as board certification, especially for Certified Hand Therapists (CHT), significantly influence earning potential, with hospital-based roles generally providing the most lucrative salaries. Therapists can enhance their earning capabilities by pursuing specialty certifications, seeking positions in high-demand settings, and considering contracts that offer year-round opportunities compared to those aligned with the school calendar. This strategic approach can make a notable difference in maximizing occupational therapist pay in Berwyn, IL.
More salary data for Berwyn, IL:
Frequently Asked Questions
How much do occupational therapists make in Berwyn, IL in 2026?
Is Berwyn, IL a good place to work as a occupational therapist?
Can occupational therapists make $100K in Berwyn?
What is the cost-of-living adjusted occupational therapist salary in Berwyn?
How much does a occupational therapist make per hour in Berwyn?
Related Pages
Compare Salaries
Career Resources
Nearby Cities in Illinois
Written by Jordan Miller, OTR/L
Career Analyst
Jordan has 10 years of experience in occupational therapy. They specialize in pediatrics and work in a rehabilitation clinic.
Methodology & Data Source
Salary figures on this page are 2026 projections based on the Bureau of Labor Statistics Occupational Employment and Wage Statistics (OEWS) survey, May 2026 release. The BLS reported a median annual salary of $95,474 for occupational therapistsin the Berwyn metropolitan area. A 3.06% compound annual growth rate (CAGR), calculated from 6-year national BLS wage trends, was applied to project current 2026 compensation. Percentile ranges (P10–P90) represent the full salary distribution across experience levels and practice settings in this market.
Data Sources & Methodology
Salary data for Berwyn is estimated from official BLS state-level occupational wage data (2025), adjusted for regional cost-of-living differences using BEA RPP (Regional Price Parities).
2026 figures are projected from 2025 BLS data using a compound annual growth rate (CAGR) of 3.06%, derived from historical BLS wage trends for occupational therapists (SOC 29-1122).
Compiled and verified by Jordan Miller, OTR/L, a licensed occupational therapist with 10+ years of clinical experience. · View source data at BLS.gov