Occupational Therapist Salary in Illinois: $101,800 (2026)
Quick Answer:Across Illinois's 65 metropolitan areas, the average median occupational therapist pay sits at $101,800/year heading into 2026 — a figure projected from 2025 BLS OEWS wage data for SOC 29-1122. Because Illinois sits at BEA RPP 97.1 (3% below the U.S. baseline), that statewide median translates to roughly $104,840 in nationally-comparable purchasing power. Highest-paying metros: Springfield ($102,810), Naperville ($100,903), Chicago ($99,860).
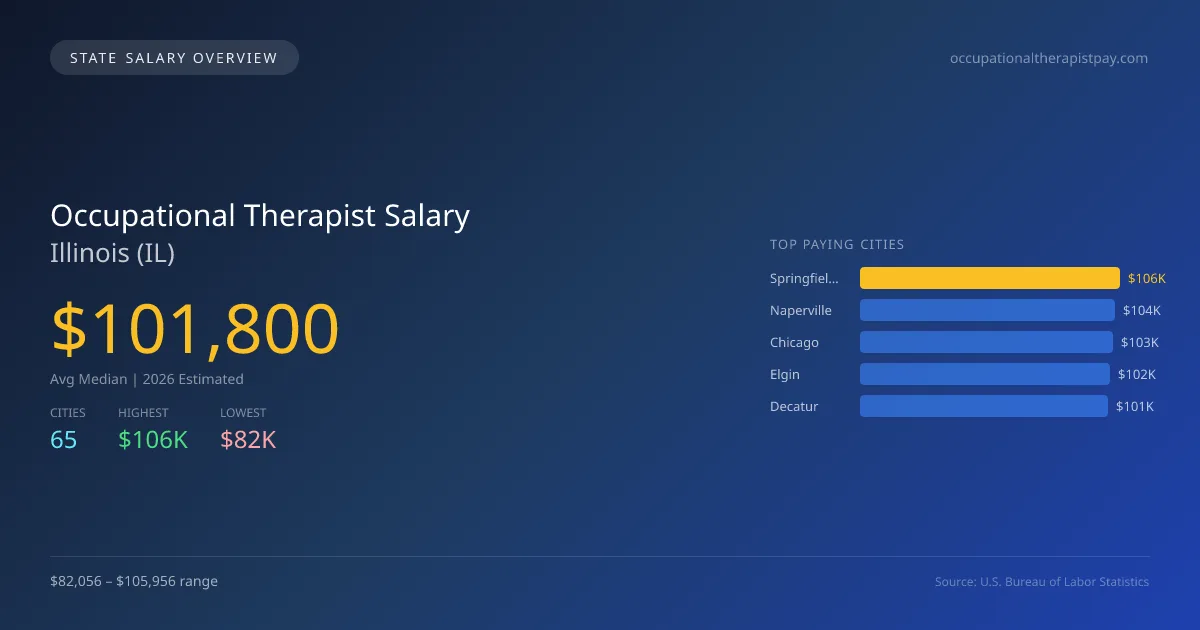
In 2026, the average median salary for occupational therapists in Illinois is projected to be $101,800, which is slightly below the national median of $103,400, reflecting a difference of 1.5%. The salary range across the state varies significantly, with the highest paying city being Springfield at $105,956, while Kankakee reports the lowest at $82,056. This $23,900 gap can be attributed to various factors including the cost of living, demand for healthcare services, and the level of experience required in different regions. Illinois has specific licensing requirements for occupational therapists, including completing a master's or doctoral degree in occupational therapy and passing the NBCOT exam. The state's scope of practice laws allow for a diverse range of interventions, further influencing demand. Significant job growth is expected in the field, with an annual compound growth rate of 3.06%, indicating a steady increase in job opportunities. Key cities like Naperville ($103,991), Chicago ($102,916), Elgin ($101,997), and Decatur ($100,967) show that urban areas tend to offer higher salaries due to population density and increased healthcare needs. As such, the job market for occupational therapists in Illinois appears to be stable with strong prospects for the foreseeable future.
Illinois Occupational Therapist Salary Range
Overall salary range in Illinois: $56,869 (lowest entry-level) to $144,277 (highest top earner)
Illinois vs National Average
Illinois occupational therapists earn 1.55% less than the national median ($-1,600/year difference).
Illinois Occupational Therapist Salary Distribution (2026)
Occupational Therapist salaries in Illinois range from $74,714 (entry-level, 10th percentile) to $138,334 (top earners, 90th percentile), with a median of $101,800. The Illinois median is $1,600 below the US national median of $103,400. The average hourly rate is $48.94/hr. Approximately 7,244 occupational therapists are employed across 65 cities.
2019 BLS Actual
$85,894
2025 BLS Actual
$98,777
2026 Current Est.
$101,800
2019–2027 Growth
+22.1%
Salary Trajectory for Occupational Therapists in Illinois (2019–2027)
2019–2025: actual BLS OEWS data for this metro area. 2026+: CAGR 3.06% projection.
| Year | Annual Salary | Status |
|---|---|---|
| 2019 | $85,894 | Actual |
| 2020 | $85,019 | Actual |
| 2021 | $92,781 | Actual |
| 2022 | $97,776 | Actual |
| 2023 | $98,633 | Actual |
| 2024 | $99,189 | Actual |
| 2025 | $98,777 | Actual |
| 2026(current) | $101,800 | Estimated |
| 2027 | $104,915 | Projected |
Based on 7 years of BLS OEWS data for the Illinois metropolitan area, the median occupational therapist salary grew 15.0% from $85,894 (2019) to $98,777 (2025). At a 3.06% compound annual growth rate, salaries are projected to reach $104,915 by 2027 — a total increase of $19,021 (22.14%) from 2019.
Note: Historical values (2019–2025) are actual BLS OEWS figures for the Illinois metropolitan area, sourced from annual Occupational Employment and Wage Statistics surveys. 2026–2026 figures are current estimates, and 2027 values are projections, calculated using a 3.06% CAGR derived from 7-year BLS historical data. Actual salaries may vary based on employer, experience, certifications, and local market conditions.
Top 5 Highest Paying Cities in Illinois
Lowest Paying Cities in Illinois
| City | Median Salary |
|---|---|
| Kankakee | $82,056 |
| Urbana | $82,189 |
| Champaign | $82,489 |
| Rock Island | $90,240 |
| Moline | $91,661 |
Best Value Cities for Occupational Therapists in Illinois
When adjusted for local cost of living, these Illinois cities offer the most purchasing power for occupational therapists.
| City | Nominal Salary | CoL Index | Adjusted Salary |
|---|---|---|---|
| Springfield | $105,956 | 92.745 | $114,244 |
| Peoria | $99,886 | 91.231 | $109,487 |
| Rockford | $99,577 | 92.154 | $108,055 |
| Naperville | $103,991 | 97.1 | $107,097 |
| Elgin | $101,997 | 97.1 | $105,043 |
Adjusted salary = nominal salary × (100 / CoL index). CoL index: 100 = national average. Lower index = lower cost of living.
Salary by Experience Level in Illinois
| Experience Level | Estimated Annual |
|---|---|
| Entry Level (0-2 years) | $74,714 |
| Mid Career (3-7 years) | $101,800 |
| Experienced (7+ years) | $138,334 |
Estimates based on BLS percentile data averaged across Illinois metro areas. Individual pay varies by employer, certifications, and specialization.
All 65 Cities in Illinois
| # | City | Median Salary |
|---|---|---|
| 1 | Springfield | $105,956 |
| 2 | Naperville | $103,991 |
| 3 | Chicago | $102,916 |
| 4 | Elgin | $101,997 |
| 5 | Decatur | $100,967 |
| 6 | Orland Park | $100,967 |
| 7 | Bolingbrook | $100,533 |
| 8 | Peoria | $99,886 |
| 9 | Palatine | $99,775 |
| 10 | Waukegan | $99,721 |
| 11 | Rockford | $99,577 |
| 12 | Mount Prospect | $99,531 |
| 13 | Hoffman Estates | $99,208 |
| 14 | Evanston | $99,019 |
| 15 | Joliet | $98,935 |
| 16 | Oak Park | $98,853 |
| 17 | Danville | $98,649 |
| 18 | Addison | $98,440 |
| 19 | Berwyn | $98,396 |
| 20 | Aurora | $98,332 |
| 21 | Tinley Park | $98,316 |
| 22 | Northbrook | $98,216 |
| 23 | St. Charles | $98,154 |
| 24 | Gurnee | $98,131 |
| 25 | Arlington Heights | $97,994 |
| 26 | Wheaton | $97,867 |
| 27 | Woodridge | $97,837 |
| 28 | Schaumburg | $97,788 |
| 29 | Buffalo Grove | $97,760 |
| 30 | Bartlett | $97,752 |
| 31 | Lake in the Hills | $97,389 |
| 32 | Collinsville | $97,373 |
| 33 | Skokie | $97,346 |
| 34 | Wheeling | $97,203 |
| 35 | Carpentersville | $97,096 |
| 36 | Oak Lawn | $97,031 |
| 37 | O'Fallon | $97,010 |
| 38 | Quincy | $96,632 |
| 39 | Algonquin | $96,632 |
| 40 | Carol Stream | $96,547 |
| 41 | Normal | $96,542 |
| 42 | Lombard | $96,485 |
| 43 | Cicero | $96,385 |
| 44 | Plainfield | $96,284 |
| 45 | Des Plaines | $96,266 |
| 46 | Oswego | $95,897 |
| 47 | DeKalb | $95,820 |
| 48 | Park Ridge | $95,743 |
| 49 | Hanover Park | $95,705 |
| 50 | Glenview | $95,696 |
| 51 | Romeoville | $95,311 |
| 52 | Streamwood | $95,179 |
| 53 | Downers Grove | $95,002 |
| 54 | Belleville | $94,978 |
| 55 | Crystal Lake | $94,823 |
| 56 | Galesburg | $94,461 |
| 57 | Calumet City | $94,430 |
| 58 | Elmhurst | $94,198 |
| 59 | Carbondale | $93,268 |
| 60 | Bloomington | $92,816 |
| 61 | Moline | $91,661 |
| 62 | Rock Island | $90,240 |
| 63 | Champaign | $82,489 |
| 64 | Urbana | $82,189 |
| 65 | Kankakee | $82,056 |
More Illinois Salary Data
Hourly Rates
Explore occupational therapist hourly pay in Illinois cities.
Senior / Experienced
Top earner salaries for experienced occupational therapists.
Compare Cities in Illinois
View all comparisons →Explore More Occupational Therapist Salary Data
Frequently Asked Questions
How much do occupational therapists make in Illinois in 2026?
What is the highest paying city for occupational therapists in Illinois?
How does Illinois occupational therapist pay compare to the national average?
What is the entry-level occupational therapist salary in Illinois?
How many occupational therapists are employed in Illinois?
Which Illinois city offers the best value for occupational therapists?
Written by Jordan Miller, OTR/L
Career Analyst
Jordan has 10 years of experience in occupational therapy. They specialize in pediatrics and work in a rehabilitation clinic.
Methodology & Data Source
Statewide salary figures on this page are 2026 projections based on the Bureau of Labor Statistics Occupational Employment and Wage Statistics (OEWS) survey, May 2026 release. A 3.06% compound annual growth rate (CAGR), derived from 6-year national BLS wage trends, was applied to each metro area's reported salary to estimate current 2026 occupational therapist compensation across Illinois. State averages are employment-weighted across 65 metro areas — larger metro areas with more occupational therapistscontribute proportionally more to the average, producing figures that better reflect typical compensation. Individual pay varies by city, employer, certifications, and experience.
Data Sources & Methodology
Source: BLS, OEWS, 7-year dataset (–). Per-city data from annual BLS metropolitan area surveys.
2026 figures are projected from 2025 BLS data using a compound annual growth rate (CAGR) of 3.06%, derived from historical BLS wage trends for occupational therapists (SOC 29-1122).
Compiled and verified by Jordan Miller, OTR/L, a licensed occupational therapist with 10+ years of clinical experience. · View source data at BLS.gov