Occupational Therapist Salary in Cicero, IL: $96,385 (2026)
Quick Answer:A full-time occupational therapist in Cicero, IL earns a median $96,385/year (≈ $46.34/hour) in nominal terms for 2026 — projected from BLS OEWS 2025 (SOC 29-1122). Once you factor in Cicero's price level (3% below national, BEA RPP 97.1), that paycheck buys what $99,264 would nationally. Nominal pay sits 3.2% below the Illinois state average.
Based on BLS state-level estimates · View source
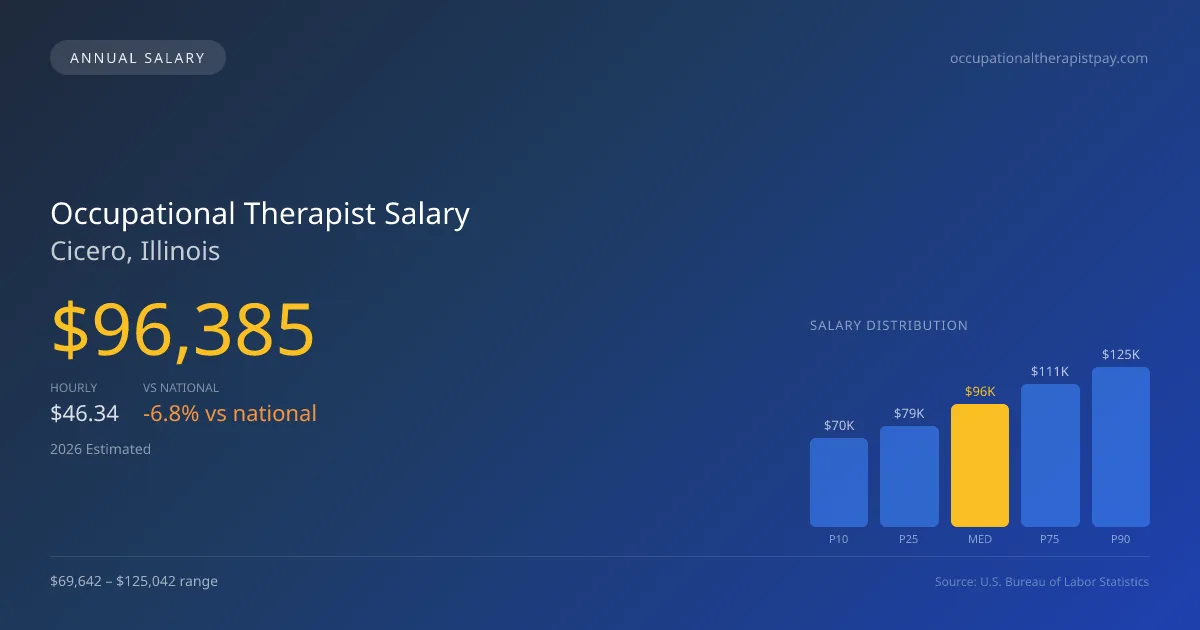
In 2026, an occupational therapist salary in Cicero, Illinois, is projected to reach $96,385 annually, reflecting the adjustment of local compensation against the broader market. This figure is part of a salary range extending from $69,642 at the 10th percentile to $125,042 at the 90th percentile. These estimates, derived from 2025 BLS data and adjusted for regional economic conditions, highlight how ongoing Medicare cuts may influence salaries in skilled nursing facilities (SNFs) and outpatient settings. The expected salary trends indicate that Cicero's job market for occupational therapy will continue to adapt, providing opportunities for professionals to navigate a competitive landscape where financial outcomes can vary significantly, particularly in the wake of healthcare policy shifts.
About the Cicero Market
Salary estimated from Illinois average ($92,000) adjusted for local cost of living.
Salary Breakdown
| Percentile | Annual | Hourly |
|---|---|---|
| Entry Level (P10) | $69,642 | $33.48 |
| Lower Range (P25) | $79,122 | $38.04 |
| Median (P50)(typical) | $96,385 | $46.34 |
| Upper Range (P75) | $111,476 | $53.59 |
| Top Earners (P90) | $125,042 | $60.11 |
Median Salary Position
6.78% below the national average
2026 Salary Percentile Distribution in Cicero
In Cicero, IL, the occupational therapist salary spread from the 10th to 90th percentile is $55,400 (2026 est.). At $96,385, the local median is 6.78% below the national median of $103,400.
Salary Calculator
At 40 hours/week in Cicero: You'd be in the lower-middle range
How Cicero Occupational Therapist Pay Compares
Cicero median: $96,385/year (2026)
| Compared To | Median Salary | Cicero Pays |
|---|---|---|
| Illinois Average | $99,571 | -3.20% less |
| National Average | $103,400 | -6.78% less |
Occupational Therapists in Cicero, IL earn a median of $96,385 per year (2026 est.), which is 6.78% lower than the national median of $103,400 and 3.20% below the Illinois state average of $99,571.
Cost-of-Living Adjusted Salary
Cicero has a cost of living 2.90% below the national average, meaning your salary goes further here.
Adjusted salary = nominal × (100 / CoL index). CoL index: 100 = national average.
Cicero, IL has a cost-of-living index of 97.1 (below the national average of 100). A occupational therapist earning $96,385 nominally has purchasing power equivalent to $99,264 in an average-cost city — an effective 2.99% boost.
Compare Purchasing Power
Select a city to see how your salary compares after cost of living
Select a city above to compare purchasing power
2019 BLS Actual
$79,186
2025 BLS Actual
$93,523
2026 Current Est.
$96,385
2019–2027 Growth
+25.4%
Salary Trajectory for Occupational Therapists in Cicero (2019–2027)
2019–2025: actual BLS OEWS data for this metro area. 2026+: CAGR 3.06% projection.
| Year | Annual Salary | Status |
|---|---|---|
| 2019 | $79,186 | Actual |
| 2020 | $80,426 | Actual |
| 2021 | $79,764 | Actual |
| 2022 | $86,858 | Actual |
| 2023 | $89,832 | Actual |
| 2024 | $86,468 | Actual |
| 2025 | $93,523 | Actual |
| 2026(current) | $96,385 | Estimated |
| 2027 | $99,334 | Projected |
Based on 7 years of BLS OEWS data for the Cicero metropolitan area, the median occupational therapist salary grew 18.1% from $79,186 (2019) to $93,523 (2025). At a 3.06% compound annual growth rate, salaries are projected to reach $99,334 by 2027 — a total increase of $20,148 (25.44%) from 2019.
Note: Historical values (2019–2025) are actual BLS OEWS figures for the Cicero metropolitan area, sourced from annual Occupational Employment and Wage Statistics surveys. 2026–2026 figures are current estimates, and 2027 values are projections, calculated using a 3.06% CAGR derived from 7-year BLS historical data. Actual salaries may vary based on employer, experience, certifications, and local market conditions.
Salary by Experience Level
| Experience | Estimated Salary Range |
|---|---|
| 0-2 years (New Graduate) | $69,642 – $79,122 |
| 3-5 years (Mid Career) | $79,122 – $96,385 |
| 5+ years (Experienced) | $96,385 – $111,476 |
| 10+ years (Top Earner) | $111,476 – $125,042 |
OT, OTR salary ranges estimated from BLS percentile data. Individual occupational therapist compensation varies by employer, certifications, and specialization.
Occupational Therapist Job Market in Cicero
The local job market currently employs 21 occupational therapists, presenting a modest but stable professional environment, with a cost-of-living index of 97.1 that indicates affordability compared to the national average. This affordability could translate to enhanced purchasing power, making the region an appealing option for those entering the field. In Cicero, skilled nursing facilities and hospital inpatient rehabilitation centers are generally known to offer the highest pay rates, while school districts and outpatient clinics may provide slightly lower salaries. The range in pay here often stems from factors such as work settings, required productivity, and the type of contracts available. For those looking to maximize their occupational therapist pay in Cicero, pursuing board certifications like the Certified Hand Therapist (CHT) credential can yield significant financial benefits. Additionally, focusing on positions with year-round contracts could enhance earning potential, especially against the backdrop of fluctuating reimbursement rates due to Medicare policy impacts.
More salary data for Cicero, IL:
Frequently Asked Questions
How much do occupational therapists make in Cicero, IL in 2026?
Is Cicero, IL a good place to work as a occupational therapist?
Can occupational therapists make $100K in Cicero?
What is the cost-of-living adjusted occupational therapist salary in Cicero?
How much does a occupational therapist make per hour in Cicero?
Related Pages
Compare Salaries
Career Resources
Nearby Cities in Illinois
Written by Jordan Miller, OTR/L
Career Analyst
Jordan has 10 years of experience in occupational therapy. They specialize in pediatrics and work in a rehabilitation clinic.
Methodology & Data Source
Salary figures on this page are 2026 projections based on the Bureau of Labor Statistics Occupational Employment and Wage Statistics (OEWS) survey, May 2026 release. The BLS reported a median annual salary of $93,523 for occupational therapistsin the Cicero metropolitan area. A 3.06% compound annual growth rate (CAGR), calculated from 6-year national BLS wage trends, was applied to project current 2026 compensation. Percentile ranges (P10–P90) represent the full salary distribution across experience levels and practice settings in this market.
Data Sources & Methodology
Salary data for Cicero is estimated from official BLS state-level occupational wage data (2025), adjusted for regional cost-of-living differences using BEA RPP (Regional Price Parities).
2026 figures are projected from 2025 BLS data using a compound annual growth rate (CAGR) of 3.06%, derived from historical BLS wage trends for occupational therapists (SOC 29-1122).
Compiled and verified by Jordan Miller, OTR/L, a licensed occupational therapist with 10+ years of clinical experience. · View source data at BLS.gov