Occupational Therapist Salary in Peoria, IL: $99,886 (2026)
Quick Answer:A full-time occupational therapist in Peoria, IL earns a median $99,886/year (≈ $48.03/hour) in nominal terms for 2026 — projected from BLS OEWS 2025 (SOC 29-1122). Once you factor in Peoria's price level (9% below national, BEA RPP 91.2), that paycheck buys what $109,487 would nationally. Nominal pay sits 0.3% above the Illinois state average.
Official BLS data · View source
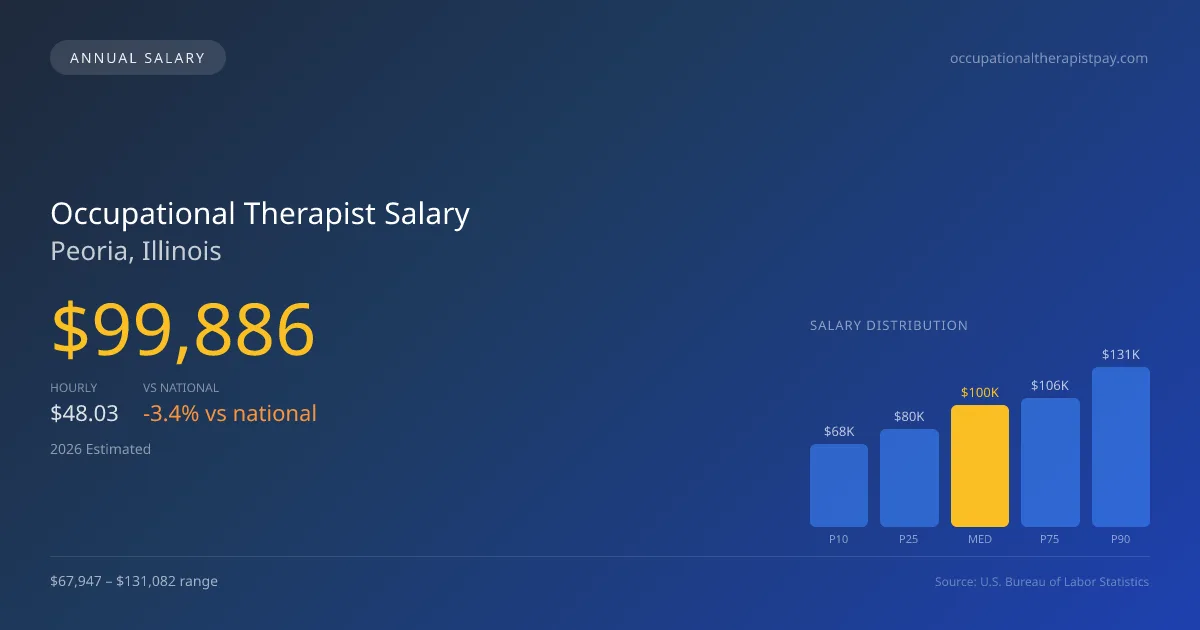
In Peoria, Illinois, occupational therapists can expect a median annual salary of $99,886 in 2026, which falls slightly below the national average. The salary range for this profession spans from $67,947 at the 10th percentile to $131,082 at the 90th percentile, highlighting a significant variance based on experience and setting. Based on 2025 BLS OEWS data, projected to 2026, these figures reflect the variety of employment options available to occupational therapists in the area. Opportunities in hospitals, schools, and skilled nursing facilities offer different trade-offs in terms of salary and job structure, with year-round roles often providing greater stability compared to those contingent on the school year.
Salary Breakdown
| Percentile | Annual | Hourly |
|---|---|---|
| Entry Level (P10) | $67,947 | $32.67 |
| Lower Range (P25) | $80,088 | $38.50 |
| Median (P50)(typical) | $99,886 | $48.03 |
| Upper Range (P75) | $105,533 | $50.74 |
| Top Earners (P90) | $131,082 | $63.02 |
Median Salary Position
3.4% below the national average
2026 Salary Percentile Distribution in Peoria
In Peoria, IL, the occupational therapist salary spread from the 10th to 90th percentile is $63,135 (2026 est.). At $99,886, the local median is 3.4% below the national median of $103,400.
Salary Calculator
At 40 hours/week in Peoria: You'd be above the median
How Peoria Occupational Therapist Pay Compares
Peoria median: $99,886/year (2026)
| Compared To | Median Salary | Peoria Pays |
|---|---|---|
| Illinois Average | $99,587 | +0.30% more |
| National Average | $103,400 | -3.40% less |
Occupational Therapists in Peoria, IL earn a median of $99,886 per year (2026 est.), which is 3.40% lower than the national median of $103,400 and 0.30% above the Illinois state average of $99,587.
Cost-of-Living Adjusted Salary
Peoria has a cost of living 8.77% below the national average, meaning your salary goes further here.
Adjusted salary = nominal × (100 / CoL index). CoL index: 100 = national average.
Peoria, IL has a cost-of-living index of 91.231 (below the national average of 100). A occupational therapist earning $99,886 nominally has purchasing power equivalent to $109,487 in an average-cost city — an effective 9.61% boost.
Compare Purchasing Power
Select a city to see how your salary compares after cost of living
Select a city above to compare purchasing power
2019 BLS Actual
$82,730
2025 BLS Actual
$96,920
2026 Current Est.
$99,886
2019–2027 Growth
+24.4%
Salary Trajectory for Occupational Therapists in Peoria (2019–2027)
2019–2025: actual BLS OEWS data for this metro area. 2026+: CAGR 3.06% projection.
| Year | Annual Salary | Status |
|---|---|---|
| 2019 | $82,730 | Actual |
| 2020 | $82,490 | Actual |
| 2021 | $89,230 | Actual |
| 2022 | $79,190 | Actual |
| 2023 | $95,070 | Actual |
| 2024 | $95,140 | Actual |
| 2025 | $96,920 | Actual |
| 2026(current) | $99,886 | Estimated |
| 2027 | $102,942 | Projected |
Based on 7 years of BLS OEWS data for the Peoria metropolitan area, the median occupational therapist salary grew 17.2% from $82,730 (2019) to $96,920 (2025). At a 3.06% compound annual growth rate, salaries are projected to reach $102,942 by 2027 — a total increase of $20,212 (24.43%) from 2019.
Note: Historical values (2019–2025) are actual BLS OEWS figures for the Peoria metropolitan area, sourced from annual Occupational Employment and Wage Statistics surveys. 2026–2026 figures are current estimates, and 2027 values are projections, calculated using a 3.06% CAGR derived from 7-year BLS historical data. Actual salaries may vary based on employer, experience, certifications, and local market conditions.
Salary by Experience Level
| Experience | Estimated Salary Range |
|---|---|
| 0-2 years (New Graduate) | $67,947 – $80,088 |
| 3-5 years (Mid Career) | $80,088 – $99,886 |
| 5+ years (Experienced) | $99,886 – $105,533 |
| 10+ years (Top Earner) | $105,533 – $131,082 |
OT, OTR salary ranges estimated from BLS percentile data. Individual occupational therapist compensation varies by employer, certifications, and specialization.
Occupational Therapist Job Market in Peoria
Peoria's job market appears robust with approximately 190 occupational therapists currently employed, offering a competitive landscape for professionals in the field. The cost of living index stands at 91.231, suggesting that salaries stretch further for residents compared to national averages. Notably, skilled nursing facilities and hospital inpatient rehabilitation centers tend to offer higher pay, while school-based roles may provide less financial incentive but offer more predictable hours. Factors contributing to salary disparities include the complexity of work settings, certification stipends—particularly for those with a Certified Hand Therapist (CHT) credential—and varying productivity expectations across different types of therapy settings. To maximize earnings, professionals should consider pursuing specialized certifications, seeking opportunities in higher-paying environments, and negotiating contracts that reflect their unique skills and experience in Peoria, IL.
More salary data for Peoria, IL:
Frequently Asked Questions
How much do occupational therapists make in Peoria, IL in 2026?
Is Peoria, IL a good place to work as a occupational therapist?
Can occupational therapists make $100K in Peoria?
What is the cost-of-living adjusted occupational therapist salary in Peoria?
How much does a occupational therapist make per hour in Peoria?
Related Pages
Compare Salaries
Career Resources
Nearby Cities in Illinois
Written by Jordan Miller, OTR/L
Career Analyst
Jordan has 10 years of experience in occupational therapy. They specialize in pediatrics and work in a rehabilitation clinic.
Methodology & Data Source
Salary figures on this page are 2026 projections based on the Bureau of Labor Statistics Occupational Employment and Wage Statistics (OEWS) survey, May 2026 release. The BLS reported a median annual salary of $96,920 for occupational therapistsin the Peoria metropolitan area. A 3.06% compound annual growth rate (CAGR), calculated from 6-year national BLS wage trends, was applied to project current 2026 compensation. Percentile ranges (P10–P90) represent the full salary distribution across experience levels and practice settings in this market.
Data Sources & Methodology
Source: BLS, OEWS, 7-year dataset (–). Per-city data from annual BLS metropolitan area surveys.
2026 figures are projected from 2025 BLS data using a compound annual growth rate (CAGR) of 3.06%, derived from historical BLS wage trends for occupational therapists (SOC 29-1122).
Compiled and verified by Jordan Miller, OTR/L, a licensed occupational therapist with 10+ years of clinical experience. · View source data at BLS.gov