Occupational Therapist Salary in Champaign, IL: $82,489 (2026)
Quick Answer:A full-time occupational therapist in Champaign, IL earns a median $82,489/year (≈ $39.66/hour) in nominal terms for 2026 — projected from BLS OEWS 2025 (SOC 29-1122). Once you factor in Champaign's price level (7% below national, BEA RPP 92.7), that paycheck buys what $88,981 would nationally. Nominal pay sits 17.2% below the Illinois state average.
Official BLS data · View source
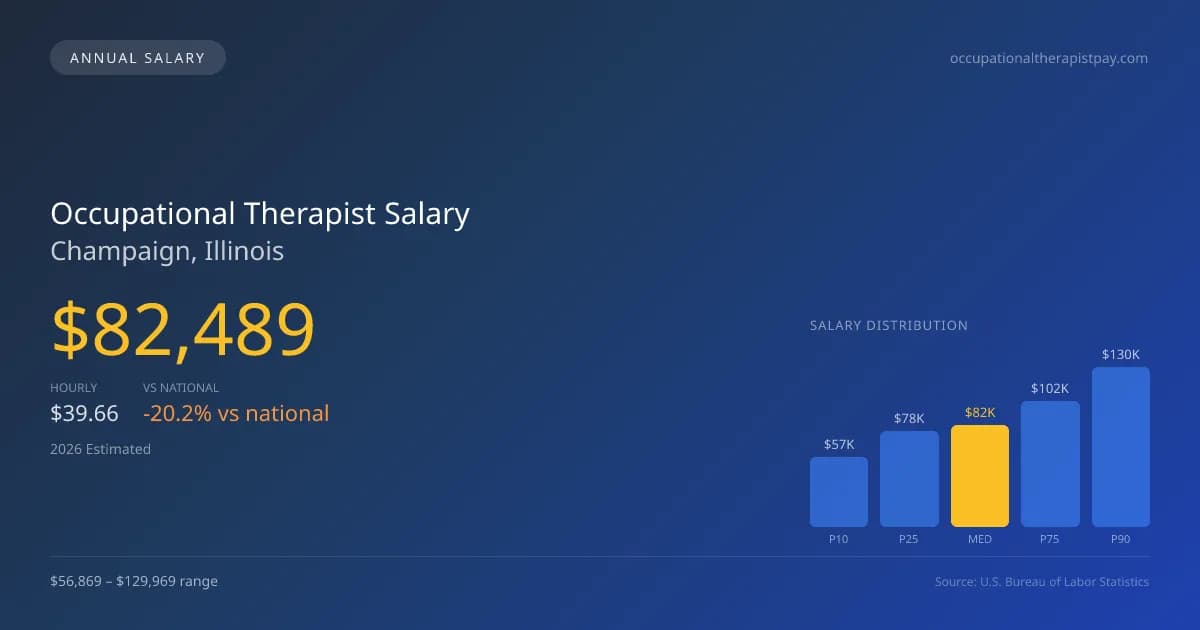
Champaign, Illinois presents a diverse setting for occupational therapists, with a median annual salary projected at $82,489 in 2026. This figure falls short of the national average of $103,400, highlighting a regional variance in occupational therapist salaries across the U.S. The pay scale ranges from $56,869 at the 10th percentile to $129,969 at the 90th percentile, indicating significant potential for income growth, especially for those who operate in high-demand settings. Occupational therapists in Champaign can choose between various employment environments, including hospitals, skilled nursing facilities, and educational institutions, all of which come with their unique benefits and pay structures.
Salary Breakdown
| Percentile | Annual | Hourly |
|---|---|---|
| Entry Level (P10) | $56,869 | $27.34 |
| Lower Range (P25) | $78,367 | $37.68 |
| Median (P50)(typical) | $82,489 | $39.66 |
| Upper Range (P75) | $102,163 | $49.12 |
| Top Earners (P90) | $129,969 | $62.49 |
Median Salary Position
20.22% below the national average
2026 Salary Percentile Distribution in Champaign
In Champaign, IL, the occupational therapist salary spread from the 10th to 90th percentile is $73,100 (2026 est.). At $82,489, the local median is 20.22% below the national median of $103,400.
Salary Calculator
At 40 hours/week in Champaign: You'd be in the lower-middle range
How Champaign Occupational Therapist Pay Compares
Champaign median: $82,489/year (2026)
| Compared To | Median Salary | Champaign Pays |
|---|---|---|
| Illinois Average | $99,625 | -17.20% less |
| National Average | $103,400 | -20.22% less |
Occupational Therapists in Champaign, IL earn a median of $82,489 per year (2026 est.), which is 20.22% lower than the national median of $103,400 and 17.20% below the Illinois state average of $99,625.
Cost-of-Living Adjusted Salary
Champaign has a cost of living 7.30% below the national average, meaning your salary goes further here.
Adjusted salary = nominal × (100 / CoL index). CoL index: 100 = national average.
Champaign, IL has a cost-of-living index of 92.704 (below the national average of 100). A occupational therapist earning $82,489 nominally has purchasing power equivalent to $88,981 in an average-cost city — an effective 7.87% boost.
Compare Purchasing Power
Select a city to see how your salary compares after cost of living
Select a city above to compare purchasing power
2019 BLS Actual
$82,850
2025 BLS Actual
$80,040
2026 Current Est.
$82,489
2019–2027 Growth
+2.6%
Salary Trajectory for Occupational Therapists in Champaign (2019–2027)
2019–2025: actual BLS OEWS data for this metro area. 2026+: CAGR 3.06% projection.
| Year | Annual Salary | Status |
|---|---|---|
| 2019 | $82,850 | Actual |
| 2020 | $81,420 | Actual |
| 2021 | $93,120 | Actual |
| 2022 | $95,720 | Actual |
| 2023 | $96,030 | Actual |
| 2024 | $96,530 | Actual |
| 2025 | $80,040 | Actual |
| 2026(current) | $82,489 | Estimated |
| 2027 | $85,013 | Projected |
Based on 7 years of BLS OEWS data for the Champaign metropolitan area, the median occupational therapist salary grew -3.4% from $82,850 (2019) to $80,040 (2025). At a 3.06% compound annual growth rate, salaries are projected to reach $85,013 by 2027 — a total increase of $2,163 (2.61%) from 2019.
Note: Historical values (2019–2025) are actual BLS OEWS figures for the Champaign metropolitan area, sourced from annual Occupational Employment and Wage Statistics surveys. 2026–2026 figures are current estimates, and 2027 values are projections, calculated using a 3.06% CAGR derived from 7-year BLS historical data. Actual salaries may vary based on employer, experience, certifications, and local market conditions.
Salary by Experience Level
| Experience | Estimated Salary Range |
|---|---|
| 0-2 years (New Graduate) | $56,869 – $78,367 |
| 3-5 years (Mid Career) | $78,367 – $82,489 |
| 5+ years (Experienced) | $82,489 – $102,163 |
| 10+ years (Top Earner) | $102,163 – $129,969 |
OT, OTR salary ranges estimated from BLS percentile data. Individual occupational therapist compensation varies by employer, certifications, and specialization.
Occupational Therapist Job Market in Champaign
The local job market for occupational therapists in Champaign features approximately 120 professionals, showcasing a steady demand in the industry. With a cost of living index of 92.704, residents enjoy a slightly lower cost of living compared to the national average, which can enhance take-home pay and overall purchasing power. Among local employers, skilled nursing facilities often offer competitive salaries, while hospital inpatient rehab and outpatient clinics tend to provide strong financial packages, particularly for those with board certifications like the CHT, which can command higher pay. Variability in occupational therapist pay in Champaign is influenced by factors such as contractual agreements between educational institutions, productivity expectations, and the impact of Medicare cuts on skilled nursing and outpatient services. For those looking to enhance their earnings, pursuing specialization credentials, gaining experience in rehabilitation settings, and seeking year-round contracts rather than those limited to the school year can maximize compensation in this market.
More salary data for Champaign, IL:
Frequently Asked Questions
How much do occupational therapists make in Champaign, IL in 2026?
Is Champaign, IL a good place to work as a occupational therapist?
Can occupational therapists make $100K in Champaign?
What is the cost-of-living adjusted occupational therapist salary in Champaign?
How much does a occupational therapist make per hour in Champaign?
Related Pages
Compare Salaries
Career Resources
Nearby Cities in Illinois
Written by Jordan Miller, OTR/L
Career Analyst
Jordan has 10 years of experience in occupational therapy. They specialize in pediatrics and work in a rehabilitation clinic.
Methodology & Data Source
Salary figures on this page are 2026 projections based on the Bureau of Labor Statistics Occupational Employment and Wage Statistics (OEWS) survey, May 2026 release. The BLS reported a median annual salary of $80,040 for occupational therapistsin the Champaign metropolitan area. A 3.06% compound annual growth rate (CAGR), calculated from 6-year national BLS wage trends, was applied to project current 2026 compensation. Percentile ranges (P10–P90) represent the full salary distribution across experience levels and practice settings in this market.
Data Sources & Methodology
Source: BLS, OEWS, 7-year dataset (–). Per-city data from annual BLS metropolitan area surveys.
2026 figures are projected from 2025 BLS data using a compound annual growth rate (CAGR) of 3.06%, derived from historical BLS wage trends for occupational therapists (SOC 29-1122).
Compiled and verified by Jordan Miller, OTR/L, a licensed occupational therapist with 10+ years of clinical experience. · View source data at BLS.gov