Occupational Therapist Salary in Normal, IL: $96,542 (2026)
Quick Answer:A full-time occupational therapist in Normal, IL earns a median $96,542/year (≈ $46.42/hour) in nominal terms for 2026 — projected from BLS OEWS 2025 (SOC 29-1122). Once you factor in Normal's price level (3% below national, BEA RPP 97.1), that paycheck buys what $99,425 would nationally. Nominal pay sits 3.0% below the Illinois state average.
Based on BLS state-level estimates · View source
Occupational therapists in Normal, Illinois can expect a median annual salary of $96,542 in 2026, reflecting a competitive position within the Midwest market. This figure sits lower than the national median of $103,400, demonstrating a slight decline of 6.63% relative to the broader country. Salary ranges for this profession in Normal are projected to span from $67,186 at the 10th percentile to $125,556 at the 90th percentile, suggesting a mix of opportunities for both entry-level and experienced clinicians. Given the local cost-of-living index of 97.1, which is below the national average, the overall financial landscape for occupational therapists is closer than it may initially appear, making this city a potentially attractive option for those looking to balance earning potential and living expenses.
About the Normal Market
Salary estimated from Illinois average ($92,000) adjusted for local cost of living.
Salary Breakdown
| Percentile | Annual | Hourly |
|---|---|---|
| Entry Level (P10) | $67,186 | $32.30 |
| Lower Range (P25) | $77,324 | $37.17 |
| Median (P50)(typical) | $96,542 | $46.42 |
| Upper Range (P75) | $111,844 | $53.77 |
| Top Earners (P90) | $125,556 | $60.36 |
Median Salary Position
6.63% below the national average
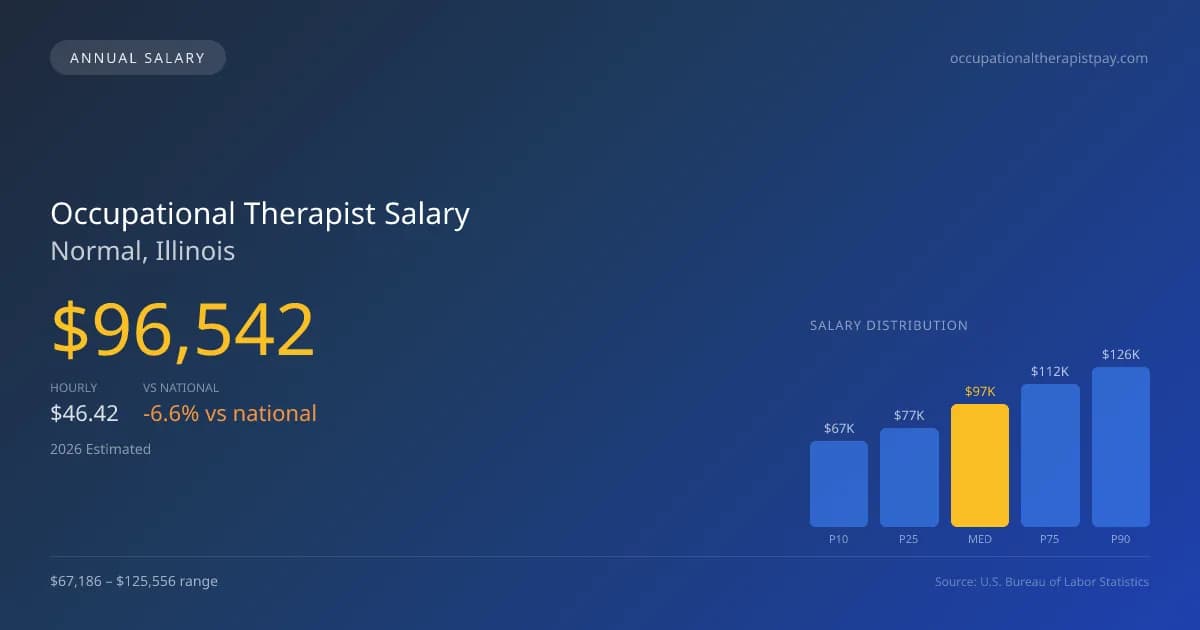
2026 Salary Percentile Distribution in Normal
In Normal, IL, the occupational therapist salary spread from the 10th to 90th percentile is $58,370 (2026 est.). At $96,542, the local median is 6.63% below the national median of $103,400.
Salary Calculator
At 40 hours/week in Normal: You'd be above the median
How Normal Occupational Therapist Pay Compares
Normal median: $96,542/year (2026)
| Compared To | Median Salary | Normal Pays |
|---|---|---|
| Illinois Average | $99,528 | -3.00% less |
| National Average | $103,400 | -6.63% less |
Occupational Therapists in Normal, IL earn a median of $96,542 per year (2026 est.), which is 6.63% lower than the national median of $103,400 and 3.00% below the Illinois state average of $99,528.
Cost-of-Living Adjusted Salary
Normal has a cost of living 2.90% below the national average, meaning your salary goes further here.
Adjusted salary = nominal × (100 / CoL index). CoL index: 100 = national average.
Normal, IL has a cost-of-living index of 97.1 (below the national average of 100). A occupational therapist earning $96,542 nominally has purchasing power equivalent to $99,425 in an average-cost city — an effective 2.99% boost.
Compare Purchasing Power
Select a city to see how your salary compares after cost of living
Select a city above to compare purchasing power
2019 BLS Actual
$79,316
2025 BLS Actual
$93,676
2026 Current Est.
$96,542
2019–2027 Growth
+25.4%
Salary Trajectory for Occupational Therapists in Normal (2019–2027)
2019–2025: actual BLS OEWS data for this metro area. 2026+: CAGR 3.06% projection.
| Year | Annual Salary | Status |
|---|---|---|
| 2019 | $79,316 | Actual |
| 2020 | $80,558 | Actual |
| 2021 | $79,895 | Actual |
| 2022 | $87,000 | Actual |
| 2023 | $89,979 | Actual |
| 2024 | $86,610 | Actual |
| 2025 | $93,676 | Actual |
| 2026(current) | $96,542 | Estimated |
| 2027 | $99,497 | Projected |
Based on 7 years of BLS OEWS data for the Normal metropolitan area, the median occupational therapist salary grew 18.1% from $79,316 (2019) to $93,676 (2025). At a 3.06% compound annual growth rate, salaries are projected to reach $99,497 by 2027 — a total increase of $20,181 (25.44%) from 2019.
Note: Historical values (2019–2025) are actual BLS OEWS figures for the Normal metropolitan area, sourced from annual Occupational Employment and Wage Statistics surveys. 2026–2026 figures are current estimates, and 2027 values are projections, calculated using a 3.06% CAGR derived from 7-year BLS historical data. Actual salaries may vary based on employer, experience, certifications, and local market conditions.
Salary by Experience Level
| Experience | Estimated Salary Range |
|---|---|
| 0-2 years (New Graduate) | $67,186 – $77,324 |
| 3-5 years (Mid Career) | $77,324 – $96,542 |
| 5+ years (Experienced) | $96,542 – $111,844 |
| 10+ years (Top Earner) | $111,844 – $125,556 |
OT, OTR salary ranges estimated from BLS percentile data. Individual occupational therapist compensation varies by employer, certifications, and specialization.
Occupational Therapist Job Market in Normal
In terms of job market dynamics, Normal employs only eight occupational therapists, hinting at a tight local job market. The relatively low cost of living means that salaries—while somewhat below national standards—can still afford a decent standard of living. Those in skilled nursing facilities and hospital inpatient rehabilitation tend to earn the highest salaries in the locality. The considerable range of pay is influenced by various factors, including the work setting, board certification stipends such as for the CHT credential, and varying productivity requirements across different facilities. Occupational therapists aiming to maximize their pay in Normal may consider pursuing specialized certifications, seeking employment in higher-paying hospital settings, or negotiating year-round contracts when possible, rather than accepting limited school-year contracts which typically yield lower compensation.
More salary data for Normal, IL:
Frequently Asked Questions
How much do occupational therapists make in Normal, IL in 2026?
Is Normal, IL a good place to work as a occupational therapist?
Can occupational therapists make $100K in Normal?
What is the cost-of-living adjusted occupational therapist salary in Normal?
How much does a occupational therapist make per hour in Normal?
Related Pages
Compare Salaries
Career Resources
Nearby Cities in Illinois
Written by Jordan Miller, OTR/L
Career Analyst
Jordan has 10 years of experience in occupational therapy. They specialize in pediatrics and work in a rehabilitation clinic.
Methodology & Data Source
Salary figures on this page are 2026 projections based on the Bureau of Labor Statistics Occupational Employment and Wage Statistics (OEWS) survey, May 2026 release. The BLS reported a median annual salary of $93,676 for occupational therapistsin the Normal metropolitan area. A 3.06% compound annual growth rate (CAGR), calculated from 6-year national BLS wage trends, was applied to project current 2026 compensation. Percentile ranges (P10–P90) represent the full salary distribution across experience levels and practice settings in this market.
Data Sources & Methodology
Salary data for Normal is estimated from official BLS state-level occupational wage data (2025), adjusted for regional cost-of-living differences using BEA RPP (Regional Price Parities).
2026 figures are projected from 2025 BLS data using a compound annual growth rate (CAGR) of 3.06%, derived from historical BLS wage trends for occupational therapists (SOC 29-1122).
Compiled and verified by Jordan Miller, OTR/L, a licensed occupational therapist with 10+ years of clinical experience. · View source data at BLS.gov